Contents
- 25 Sep 2026
Tableau to Power BI Migration: Semantic Layer First
Quick Summary
Tableau to Power BI migration involves rebuilding the data foundation, calculations, security, and reports rather than converting a workbook from one file format to another. The most technically sensitive areas are Tableau LOD expressions, table calculations, data-model redesign, security, and visual differences between the two platforms. A semantic-layer-first approach addresses the data model before calculations and report design, giving multiple Power BI reports a governed foundation instead of recreating workbook logic independently. Automation can accelerate migration for repeatable components, while complex calculations, advanced visuals, security, and validation require expert review.

- Share Post:
-

-

Key Takeaways
- Tableau to Power BI migration is a platform re-engineering exercise, not a .twb or .twbx file conversion.
- Design the Power BI semantic model before rebuilding complex calculations or report visuals.
- Re-derive Tableau LOD expressions and table calculations in DAX based on their intended business logic.
- Tableau calculated fields may become DAX measures, calculated columns, Power Query transformations, or a mix of model and calculation logic, depending on their purpose.
- Tableau dashboards are generally rebuilt as Power BI reports rather than converted pixel-for-pixel.
- Tableau User Filters and Power BI row-level security are different mechanisms and require security redesign and validation.
- Tableau Prep workflows may be rebuilt using Power Query and other Power BI or Microsoft data-platform capabilities depending on the architecture.
- Evaluate licensing based on the organization's users, workloads, capacity requirements, and existing Microsoft agreements rather than by directly comparing product names.
- Automation can accelerate repeatable migration work, while complex LOD logic, table calculations, advanced visuals, security, and validation require specialist review.
- A phased approach- assess, model, rebuild, validate, and deploy- reduces downstream rework, the same phased discipline covered in our key checklist for BI modernization.
What Is Tableau to Power BI Migration?
Tableau to Power BI migration is the structured process of moving analytics workloads from Tableau to Microsoft Power BI and rebuilding them using Power BI's native data, modeling, calculation, visualization, security, and deployment capabilities.
A typical migration can include Tableau data sources and connections, Tableau Prep transformations, data relationships and business logic, calculated fields, LOD expressions, table calculations, filters and interactions, dashboards and worksheets, user filters and security rules, and Tableau Server or Tableau Cloud publishing structures.
The destination is not simply another copy of the Tableau workbook. The data foundation is typically redesigned as a Power BI semantic model, calculations are implemented using DAX and/or Power Query where appropriate, and Tableau dashboards are rebuilt as Power BI reports, the same semantic-layer-first principle that also governs how we approach BusinessObjects universes rebuilt as DAX for a different source platform.
For organizations considering Microsoft Fabric as part of the target architecture, the semantic model can also be used with Power BI capabilities within Fabric. See our Tableau to Microsoft Fabric migration guide for the Fabric-specific architecture, or our broader ETL migration to Microsoft Fabric guide if ETL and orchestration are also part of the target platform decision.
Why a Semantic-Layer-First Approach Matters
The semantic model is the foundation of a Power BI implementation. It defines how business entities, relationships, measures, dimensions, and analytical logic are represented for report authors and users.
A migration that starts by rebuilding Tableau visuals can reproduce a workbook's appearance while carrying forward inefficient or duplicated logic. A semantic-layer-first approach reverses that sequence:
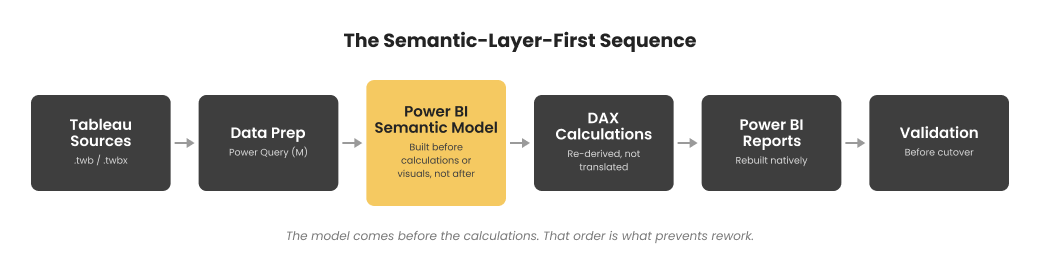
The model is designed before complex calculations, and visualizations are rebuilt. This allows multiple reports to use shared definitions for measures and dimensions instead of recreating the same business logic independently, the same governed-model-first principle covered in our key checklist for BI modernization and applied identically in our Cognos to AWS QuickSight and OBIEE to Microsoft Fabric migrations for other source platforms.
A typical Power BI semantic model uses a dimensional or star-schema approach, with fact tables, dimension tables, relationships, and reusable measures. The exact design depends on the source systems and reporting requirements, the same data-lake-adjacent design discipline covered in our data lake work.
Why this reduces migration risk. A properly designed semantic model establishes consistent business definitions across reports, reduces duplicated calculations, provides a controlled foundation for DAX measures, improves report development consistency, makes performance tuning easier, and supports multiple reports from the same governed model. The goal is not to reproduce every Tableau worksheet exactly as it exists, but to preserve the business meaning of the analytics while implementing it natively in Power BI.
Why Enterprises Migrate from Tableau to Power BI
- Microsoft ecosystem alignment. Organizations already using Microsoft 365, Azure, Teams, Entra ID, or Microsoft Fabric may consolidate analytics on Power BI to align reporting with their existing technology environment, the same consolidation logic covered in our Azure to Microsoft Fabric migration guide.
- Licensing and commercial considerations. Power BI licensing uses a different structure from Tableau. Organizations may evaluate Power BI Pro, Premium Per User, Fabric capacity, existing Microsoft agreements, user populations, and workload requirements alongside Tableau licensing. The resulting cost depends on the organization's architecture and user requirements rather than a simple product-to-product comparison, the same cost-modeling approach covered in our Amazon QuickSight vs Tableau and QuickSight vs Tableau pricing comparisons for a different target platform.
- Azure and Microsoft data-platform integration. Power BI can integrate with Microsoft's broader data ecosystem, including Azure and Microsoft Fabric. Organizations moving toward Fabric may use Power BI reports and semantic models as part of a wider modernization strategy, the same integration path covered in our Tableau to Microsoft Fabric migration guide and our Databricks to Microsoft Fabric migration guide for organizations weighing a lakehouse target instead.
- Governance and administration. Power BI provides workspaces, Apps, deployment pipelines, sensitivity labels, identity integration, and other Microsoft administration capabilities that can fit organizations already operating within the Microsoft ecosystem, the same governance model covered in our Oracle Analytics Cloud to Power BI migration guide.
- Vendor consolidation. Following mergers, platform-standardization initiatives, or technology rationalization programs, organizations may choose to reduce the number of analytics platforms they maintain and migrate existing Tableau content to Power BI, the same consolidation driver covered in our MicroStrategy to Power BI and WebI/Cognos to Power BI migration guides for organizations consolidating from different legacy platforms.
Tableau vs Power BI: Side-by-Side Comparison
This comparison focuses on areas that directly affect migration effort, using the same comparison-first framing as our Snowflake vs Databricks and Snowflake vs Microsoft Fabric comparisons for the data-platform layer beneath the BI tools.
| Dimension | Tableau | Power BI |
|---|---|---|
| Analytics engine | Hyper | VertiPaq / Power BI storage and query engine |
| Calculation language | Calculated fields, LOD expressions, table calculations | DAX |
| Data preparation | Tableau Prep | Power Query (M) and other Microsoft data capabilities |
| Workbook/report format | .twb / .twbx | .pbix / .pbit |
| Analytical model | Tableau data sources and relationships | Power BI semantic model |
| Row-level security | User filters and data-source/security mechanisms | DAX RLS and identity-based security |
| Publishing | Tableau Server / Tableau Cloud | Power BI Service / Microsoft Fabric |
| Lifecycle management | Tableau projects/sites | Power BI workspaces, Apps, deployment capabilities |
| Licensing | Creator / Explorer / Viewer | Power BI Pro / Premium Per User / Fabric capacity |
The biggest migration difference isn't the file format; it's the underlying calculation and modeling approach. Tableau's LOD expressions and table calculations work differently from DAX's filter context and evaluation model. Calculation migration should focus on business intent and result equivalence, rather than direct syntax replacement, the same conversion philosophy covered in our MicroStrategy to Tableau and MicroStrategy to Jaspersoft migration guides for organizations converting schema-driven metrics into a different calculation language entirely.
Tableau to Power BI Asset Mapping
A Tableau migration spans several layers rather than one single conversion; each Tableau asset maps conceptually to its Power BI equivalent, not one-to-one, the same layered asset-mapping discipline covered in our Crystal Reports to Power BI, OBIEE to Power BI, and Hyperion IR to Power BI migration guides for other legacy BI platforms landing on the same target.
| Tableau Asset | Power BI Equivalent | Migration Note |
|---|---|---|
| .twb / .twbx workbook | .pbix / Power BI report | Rebuilt, not imported |
| Tableau data source | Power BI semantic model/source connection | Sources and relationships redesigned for the target architecture |
| Tableau Prep flow | Power Query or appropriate data-transformation process | Rebuilt using Power Query or other Microsoft data-platform capabilities |
| Calculated field | DAX measure, calculated column, or Power Query logic | Destination depends on the calculation's purpose |
| LOD expression | DAX/model logic based on business intent | Re-derived, not translated symbol-for-symbol |
| Table calculation | DAX measure using appropriate iterator or window-function patterns | Validated against original output, not assumed equivalent |
| Tableau worksheet | Power BI report page/visual structure | Recreated using Power BI-native visuals |
| Tableau dashboard | Power BI report page or collection of report pages | Functional equivalence, not pixel-for-pixel |
| User Filter | Power BI RLS/security design | Redesigned around Power BI's security model |
| Tableau Server / Cloud | Power BI Service / Microsoft Fabric | Content structure, identity, and permissions redesigned, not copied |
A Tableau object may require several Power BI components to reproduce the same business behavior, which is why this migration is a layered modernization project rather than a document-format conversion, the same layered-not-literal principle covered in our Oracle to Microsoft Fabric and Oracle to Azure Data Factory migration guides for a similarly non-literal source-to-target mapping exercise.
Tableau LOD to DAX: What Changes?
LOD-to-DAX conversion is one of the most important technical parts of a Tableau migration. Tableau provides three primary LOD expression types: FIXED, which calculates at a specified level of detail; INCLUDE, which adds dimensions to the calculation's level of detail; and EXCLUDE, which removes dimensions.
Power BI uses DAX and its filter-context evaluation model instead of Tableau's LOD syntax. For example, a Tableau FIXED calculation might define a result at a customer or region level regardless of the dimensions displayed in a particular worksheet. The Power BI implementation must reproduce that intended evaluation behavior using the appropriate combination of model relationships, filter context, and DAX.
The conversion should follow business requirement → calculation grain → filter behavior → DAX implementation → result validation, rather than Tableau syntax → DAX syntax, the same intent-first conversion approach covered in our Replicating Oracle Analytics Server Narrative Views in Power BI guide for a different, but equally intent-driven, calculation-conversion challenge.
You can rebuild table calculations such as running totals, rankings, moving averages, percent-of-total calculations, and period-over-period calculations using DAX measures, iterators, or window-function patterns, depending on the calculation. Because table calculations depend heavily on the view and its evaluation context, they should be validated against the original Tableau output rather than treated as simple formula conversions, the same result-equivalence principle covered in our guide to automating ETL testing with Python.
Step-by-Step Tableau to Power BI Migration Process
A structured sequence helps prevent data-layer errors from reproducing across reports, the same discipline covered in our Cloud Migration to Databricks guide, which follows an identically layered assess-model-rebuild-validate sequence for a data-platform migration rather than a BI-tool migration.
01 Assess → 02 Model → 03 Rebuild Data Logic → 04 Convert Calculations → 05 Rebuild Reports → 06 Validate → 07 Deploy
- Inventory and assess. Catalog Tableau workbooks, worksheets, dashboards, data sources, Tableau Prep flows, calculated fields, LOD expressions, table calculations, custom visuals, filters and parameters, User Filters, Server/Cloud dependencies, and scheduled refreshes. Score workbooks by complexity so you can migrate simple reports separately from calculation-heavy or highly customized content, using the same complexity-scoring approach covered in our key checklist for BI modernization.
- Design the Power BI semantic model. Determine fact and dimension tables, relationships, data grain, business hierarchies, reusable measures, required dimensions, security boundaries, and refresh requirements before rebuilding reports.
- Rebuild the data layer. Reconnect to required source systems or redesign the data-preparation process, recreating Tableau Prep transformations using Power Query or other appropriate Microsoft data capabilities. Validate row counts, data types, null handling, data grain, join behavior, aggregations, and transformation results before moving to complex calculations, the same row-level validation discipline covered in our guide to automating ETL testing with Python.
- Re-derive calculations. Translate calculated fields, LOD expressions, and table calculations based on business intent, and compare each key measure against the Tableau result using representative filters, dimensions, and edge cases.
- Rebuild Power BI reports. Recreate worksheets and dashboards using Power BI-native charts, tables, cards, slicers, filters, drill-through, tooltips, bookmarks, interactions, and conditional formatting, targeting functional and analytical equivalence rather than a pixel-for-pixel reproduction of Tableau's canvas.
- Re-implement security. Map existing Tableau security requirements to DAX row-level security, workspace permissions, Apps, Microsoft Entra ID identities, security groups, and sensitivity and governance controls, testing with representative user identities before production deployment.
- Deploy and configure. Publish validated content to Power BI Service or the target Microsoft environment, configuring semantic-model refresh, gateways, workspaces, Apps, deployment pipelines, permissions, and monitoring.
- Validate and cut over. Compare record counts, aggregations, KPI values, filters, date logic, LOD-derived calculations, table calculations, security behavior, report interactions, and performance before decommissioning Tableau. For high-value reports, a controlled parallel-run period lets users compare Tableau and Power BI results before retiring the Tableau environment, using the same parallel-run discipline covered in our guide to BI automation for report migration.
Migration Challenges
A Tableau workbook should not be treated as a package that can simply be imported into Power BI. Complex LOD expressions, table calculations, advanced or unsupported visual types, Tableau-specific parameters and interactions, Tableau Prep workflows, User Filters and security rules, workbook-specific data-source logic, custom SQL, dashboard layout and interaction behavior, and Tableau Server/Cloud permissions and publishing structures all commonly require redesign or manual intervention. Automation can reduce repetitive work, but validation remains essential because two platforms can produce different results even when the original business requirement appears similar; the same automation-with-validation caution covered in our Cognos to AWS QuickSight and Tableau to Amazon QuickSight migration guides.
- LOD and table-calculation conversion. Complex FIXED, INCLUDE, EXCLUDE, and table-calculation logic may require substantial DAX redesign and validation.
- Data-model redesign. A Tableau workbook may contain data sources and relationships structured around individual analytical requirements. Power BI benefits from a reusable semantic model that can support multiple reports, as covered in our BusinessObjects to Power BI migration guide.
- Visual differences. Not every Tableau visualization or interaction has a direct Power BI equivalent. Some designs may need to be recreated using native Power BI visuals or appropriate custom visuals.
- Security migration. Tableau User Filters and Power BI RLS work differently. Security requirements must be redesigned and tested, not copied directly.
- Performance. Hyper and Power BI use different data-processing and storage approaches. The migrated model may require separate tuning for model size, query behavior, refresh duration, and storage mode.
- Skills and adoption. Tableau authors may need training in DAX, Power Query, Power BI semantic modeling, Power BI report development, and Microsoft security and deployment practices.
Power BI Licensing After Tableau Migration
Evaluate licensing as part of the migration architecture rather than treating it as a simple product-to-product substitution. Consider the number of report authors and consumers, Power BI Pro requirements, Premium Per User requirements, Fabric capacity requirements, existing Microsoft agreements, workspace architecture, report distribution model, embedded analytics requirements, and data volume and workload requirements.
Organizations already invested in Microsoft's broader ecosystem may also evaluate whether existing licensing and capacity arrangements can support the target Power BI environment, including the same licensing-architecture evaluation covered in our ETL migration to Microsoft Fabric guide and our Azure to Microsoft Fabric migration guide for F-SKU capacity planning. The correct licensing model depends on the organization's users, workloads, architecture, and Microsoft commercial agreements, not a direct comparison of product names.
Best Practices
- Start with the semantic model. Don't start by rebuilding every Tableau dashboard independently. Establish the data model and business definitions first.
- Migrate by business intent. Document what each calculation is intended to measure before translating it into DAX.
- Separate simple and complex workloads. Straightforward workbooks can move through an accelerated migration path, while LOD-heavy, calculation-heavy, or highly customized workbooks should receive deeper technical assessment- the same tiered-complexity approach covered in our BRIO/SQR to OAS migration guide, which categorizes legacy reports as simple, complex, or ultra-complex for the same planning reasons.
- Validate calculations systematically. Build a reconciliation matrix covering important Tableau and Power BI measures, validated across different dimensions, filters, time periods, edge cases, null values, and security contexts, the same reconciliation discipline covered in our key checklist for BI modernization.
- Rebuild reports natively. Avoid trying to reproduce every Tableau layout pixel-for-pixel. Use Power BI-native interaction and visualization capabilities where they provide equivalent business functionality.
- Treat security as a migration workstream. Identify security requirements during assessment and test them throughout the migration, not just at final deployment.
- Plan migration waves. Group workbooks by business domain, complexity, dependencies, and business criticality, starting with a controlled set of reports before moving the broader estate.
- Automate repeatable work. Use automation for repetitive asset mapping, source analysis, standard calculations, and common visual conversion where supported. Reserve specialist effort for areas that require semantic interpretation and validation, the same tool-plus-expert model covered across our report conversion and ETL Solutions services.
- Train report authors. Prepare Tableau authors for DAX, Power Query, semantic modeling, and Power BI report development before handing over the new environment.
- Run parallel validation before cutover. For business-critical reports, compare Tableau and Power BI results before users move completely to the new platform; the same parallel-validation approach is reflected in our Hyperion/BRIO to BI Publisher customer story, where a real migration ran both platforms in parallel before cutover.
Frequently Asked Questions
Ready to Migrate Tableau to Power BI?
A successful Tableau-to-Power BI migration is more than rebuilding dashboards. The data model, calculations, security, and report architecture must work together. DataTerrain combines automated conversion technology with specialist review to help organizations assess Tableau workbooks, accelerate repeatable migration tasks, rebuild complex logic, and validate Power BI output against the original environment- the same broad platform coverage reflected in our best data analytics services.
Related Reading
Tableau to Microsoft Fabric Migration | Tableau to Amazon QuickSight: LOD, SPICE, and Security | MicroStrategy to Tableau: Automated Migration | MicroStrategy to Power BI Migration | MicroStrategy to Jaspersoft: Metrics Rebuilt as JRXML | BI Reports Migration to Power BI | BusinessObjects to Power BI Migration | WebI/Cognos to Power BI Migration Challenges | Crystal Reports to Power BI Migration | OBIEE to Power BI Migration | OBIEE to Microsoft Fabric: RPD Rebuilt on OneLake | Oracle Analytics Cloud to Power BI Migration | Replicating Oracle Analytics Server Narrative Views in Power BI | Hyperion IR to Power BI: A Decade Past End of Life | Cognos to AWS QuickSight Migration | Amazon QuickSight vs Tableau | ETL Migration to Microsoft Fabric | Azure to Microsoft Fabric Migration | Databricks to Microsoft Fabric Migration