Contents
- 25 Aug 2026
Crystal Reports to Power BI Migration: The Complete Enterprise Guide
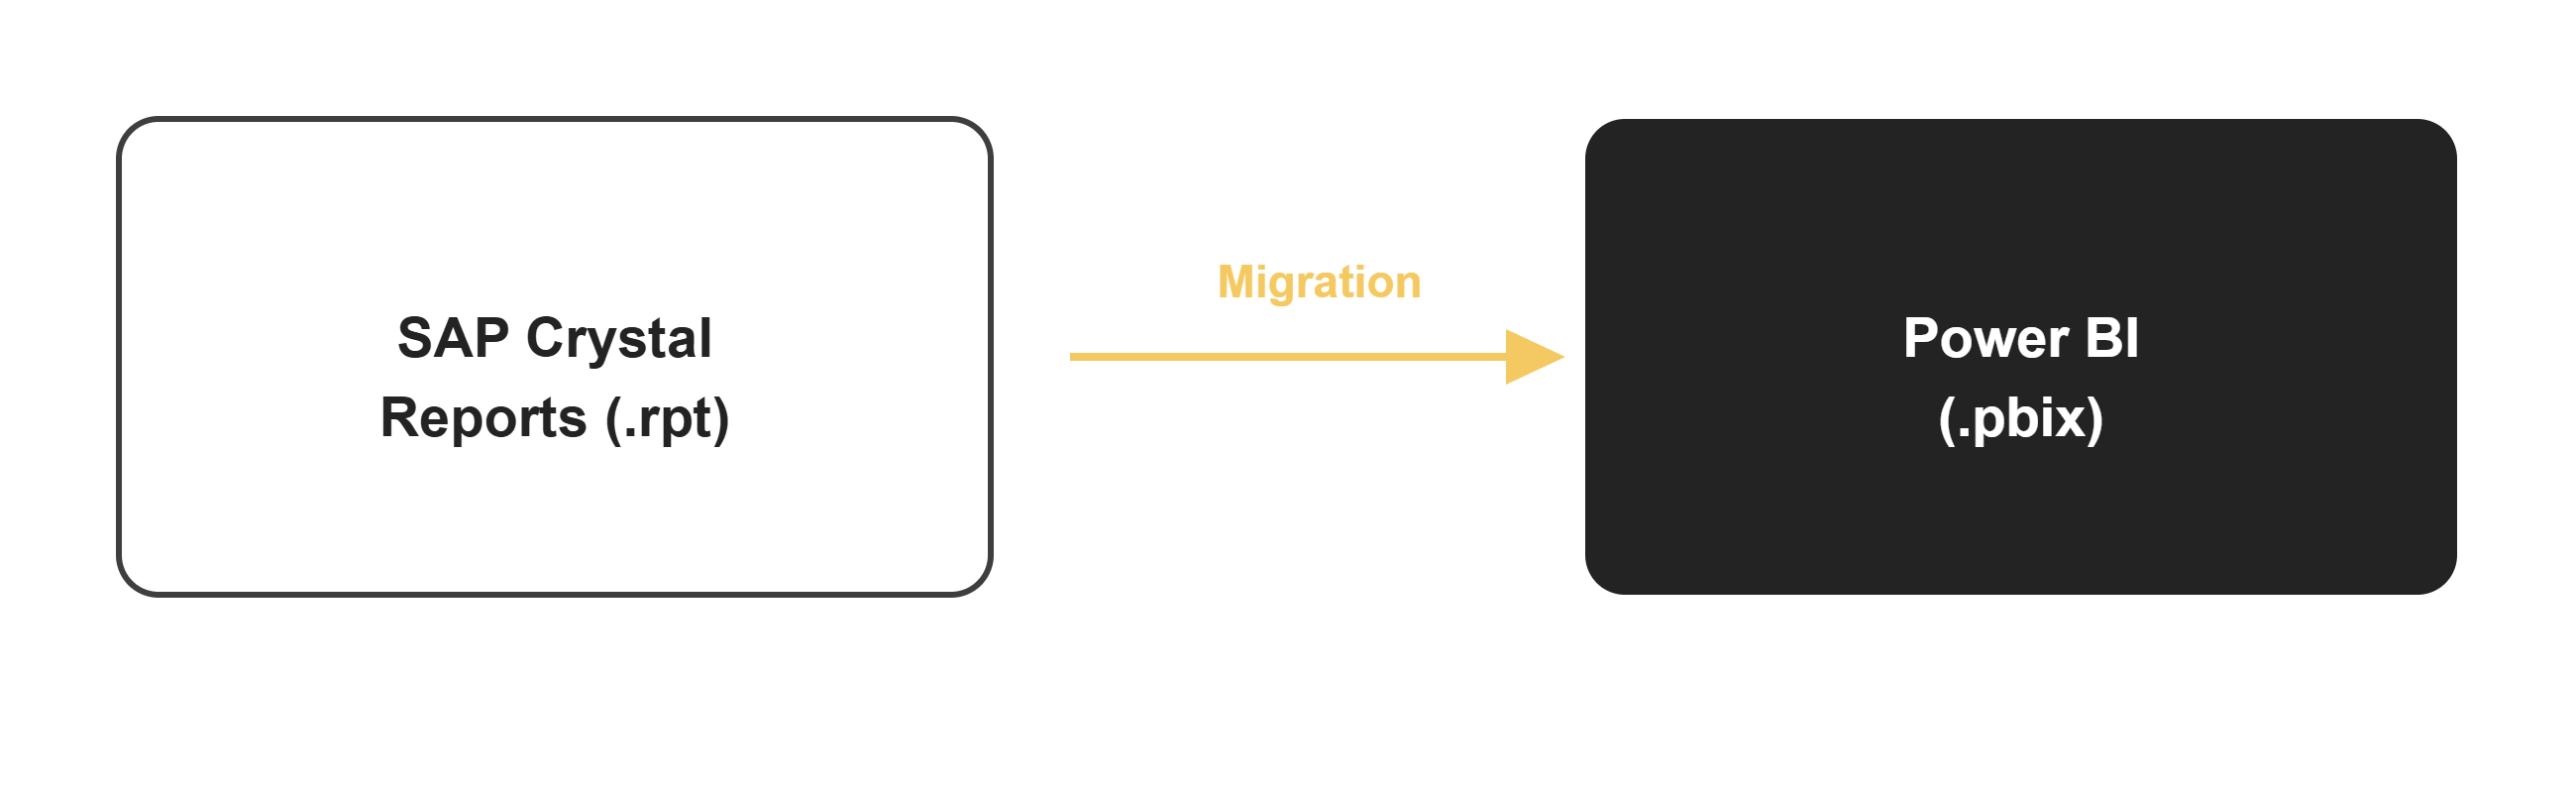
Figure 1. From pixel-perfect .rpt files to modern, interactive Power BI reporting
SAP Crystal Reports has powered pixel-perfect operational reporting for decades. As organizations approach version-specific mainstream maintenance deadlines and modernize their analytics environments, many are evaluating a Crystal Reports to Power BI migration. This guide covers the full migration process: from .rpt file inventory through formula conversion, subreport redesign, star schema data modeling, validation, and production deployment.

- Share Post:
-

-

Why Enterprises are Moving From Crystal Reports to Power BI
Crystal Reports end of life 2027: Crystal Reports 2020 loses mainstream maintenance on December 31, 2026. Crystal Reports 2025 follows on December 31, 2027. After mainstream maintenance ends, SAP's maintenance strategy may offer customer-specific options depending on the product and customer agreement. Organizations should verify their specific support entitlement with SAP and should not assume that mainstream maintenance dates mean the software will immediately stop functioning. Once mainstream maintenance ends, reports continue running but no longer receive security patches and bug fixes under standard terms.
Interactive analytics: Crystal Reports produces pixel-perfect static output. Power BI enables interactive filtering, drill-through, cross-report navigation, bookmarks, and self-service data exploration that Crystal Reports cannot match natively.
Modern semantic modeling: Crystal Reports often relies on per-report SQL commands. Power BI benefits from reusable semantic models with shared DAX measures, which provide consistent KPI definitions across all reports rather than logic embedded separately in each .rpt file.
Microsoft ecosystem integration: Power BI integrates natively with Microsoft 365, Teams, SharePoint, Azure, and Microsoft Fabric, enabling distribution and collaboration within tools organizations already use.
Reduced maintenance cost: Crystal Reports estates accumulate formula-heavy, hard-to-maintain reports that depend on specialized developers. Power BI's self-service model and governed semantic models reduce this dependency over time.
Crystal Reports vs Power BI: Architecture Comparison
| SAP Crystal Reports | Microsoft Power BI |
|---|---|
| .rpt report file | .pbix interactive report or .rdl paginated report |
| Report-level SQL commands | Star schema semantic model, Power Query, or database views |
| Crystal formula fields | DAX measures or calculated columns |
| Subreports | Drill-through pages, related pages, or bookmarks |
| Parameters and prompts | Slicers, filters, and Power Query parameters |
| Static pixel-perfect layout | Interactive canvas (.pbix) or paginated layout (Report Builder) |
| Report-specific data access | Shared semantic models reused across reports |
Can .rpt Files Be Directly Converted to Power BI?
Not through a native one-click file conversion. Crystal Reports .rpt files encode layout, formulas, SQL commands, subreports, and formatting in a proprietary format that has no direct import path into Power BI. Migration requires analyzing the .rpt contents, mapping each element to its Power BI equivalent, redesigning the underlying data model, rebuilding the report, and validating outputs against the original.
Automated tooling can accelerate .rpt analysis, formula extraction, metadata cataloging, and structural conversion, particularly at scale where reviewing hundreds of reports manually is impractical. Complex business logic, star schema data model design, and output validation still require expert review regardless of the tooling used. DataTerrain's Automated BI reports conversion service accelerates this process for large Crystal Reports estates.
Crystal Reports Asset Mapping to Power BI
| Crystal Reports Asset | Power BI Equivalent | Migration Approach |
|---|---|---|
| .rpt (print layout) | Power BI paginated report (.rdl) | Best for fixed-layout, print-ready output |
| .rpt (dashboard style) | Power BI interactive report (.pbix) | Rebuilt as native visuals with slicers |
| Crystal formula field | DAX measure or calculated column | Evaluate row vs aggregate context before translating |
| Subreport | Drill-through page or related page | No direct equivalent: redesign by purpose |
| SQL command | Star schema semantic model or Power Query | Redesign as reusable model, not per-report SQL |
| Parameter/prompt | Slicer, filter, or Power Query parameter | Redesign for Power BI filter model |
| Cross-tab | Matrix visual or paginated report matrix | Rebuild with DAX measures |
| Security and access | Workspace permissions and RLS | Map and validate per user group |
Crystal Formula to DAX Conversion
Crystal formula to DAX conversion is one of the highest-effort stages of a Crystal Reports to Power BI migration. Crystal formulas evaluate in a row-by-row, section-based context tied to the report's grouping structure. Power BI DAX evaluates in a filter-context model that works differently: a formula that produces the correct result in Crystal Reports may not produce the same result if copied directly into DAX.
The correct Power BI equivalent depends on whether the original Crystal formula is evaluated row by row, at group level, or as an aggregate calculation. The most common conversion patterns are:
- Conditional logic (If/Else) becomes DAX IF or SWITCH within a measure or calculated column
- Aggregations (Sum, Count, Average) become DAX aggregation functions within a measure
- Row-level expressions operating on individual record fields become Power BI calculated columns
- Running totals require DAX window functions or Power Query cumulative calculations
- Date and period calculations use DAX time intelligence functions such as DATEADD and CALCULATE
Some Crystal formula logic may be better placed in Power Query, in a SQL view at the source layer, or in ETL pipelines rather than recreated in DAX. Report-level SQL commands that feed formulas are typically redesigned as part of the star schema data model rather than carried forward as embedded queries.
Crystal Subreports to Power BI
Crystal subreports have no direct Power BI equivalent. In Crystal Reports, subreports allow a secondary report to be nested inside a primary report, sharing data context or running independently. Power BI's architecture handles these patterns differently, and each subreport requires an individual design decision based on its purpose:
| Crystal Subreport Purpose | Power BI Approach |
|---|---|
| Summary to detail navigation | Power BI drill-through page |
| Related data in same report | Related report page or additional visual |
| Contextual supporting information | Tooltip visual page |
| Nested printed content | Power BI paginated report with subreport |
| Different analytical views | Bookmarks or navigation buttons |
| Independent data source | Separate semantic model or Power BI report |
Deeply nested subreports are the most complex migration component in a Crystal Reports modernization project. They rarely have a clean one-to-one equivalent and often benefit from redesign rather than literal translation: using Power BI's native interaction model to deliver the same analytical value.
Interactive Power BI Reports vs Paginated Reports
One of the most important decisions in a Crystal Reports to Power BI migration is choosing the correct output type for each report:
Use Power BI paginated reports (Report Builder) when the Crystal Report requires a fixed, print-ready layout; precise column and row positioning; multi-page output; invoices, statements, or regulatory documents; or controlled PDF/Excel export formatting. Paginated reports preserve the pixel-perfect quality that Crystal Reports users expect from operational documents.
Use interactive Power BI reports (.pbix) when users need filtering, drill-through, cross-report navigation, or data exploration. Most summary, executive, and analytical Crystal Reports are better rebuilt as interactive dashboards than as static page layouts.
Use a hybrid approach when the same data needs both a printable operational view and an interactive analytical view: deliver the paginated report for printing and the interactive report for exploration.
The migration is an opportunity to assess which format each report actually needs rather than defaulting to paginated reports for every .rpt file simply because the layouts look similar.
Star Schema Data Modeling for Power BI
Crystal Reports often connects directly to source databases through per-report SQL commands: each report defines its own queries, joins, and data extraction logic. Power BI performs best when built on a reusable star schema semantic model, where business logic is defined once and shared across all reports.
Designing a Power BI star schema involves identifying fact tables (transactions, measurements, events) and dimension tables (date, customer, product, geography), establishing relationships between them, and building a library of DAX measures that define KPIs, aggregations, and business calculations consistently. This replaces embedding SQL in every Crystal Report with a shared data layer that any report can use.
Organizations that build the semantic model before rebuilding individual reports see significantly better results: DAX measures are defined once and validated, rather than recreated separately in each report where they can diverge.
Report Inventory and Audit
A report inventory and audit is the necessary first step in any Crystal Reports migration. Without it, migration teams have no reliable basis for estimating effort, sequencing work, or identifying which reports actually need migrating. For each .rpt file, the inventory should capture:
- Report name, business owner, and department
- Last accessed date and usage frequency
- Data sources and connection type
- Number and complexity of Crystal formula fields
- Number and nesting depth of subreports
- Embedded SQL commands or stored procedures
- Parameters and prompts
- Security and distribution requirements
- Complexity score: simple, medium, complex, or very complex
Usage data is as important as technical complexity. Reports with no usage in six to twelve months are strong candidates for retirement rather than migration. Large Crystal Reports estates typically reveal that a meaningful proportion of reports are duplicates, near-duplicates, or obsolete: retiring these before migration significantly reduces scope and cost.
Step-by-Step Crystal Reports to Power BI Migration Process
Step 1: Report inventory. Catalog every .rpt file in production, documenting formulas, subreports, SQL commands, parameters, data sources, and usage. Score by complexity.
Step 2: Report rationalization. Retire duplicate, obsolete, and zero-usage reports. Identify consolidation opportunities where multiple Crystal Reports covering similar content can be replaced by one interactive Power BI report with filters.
Step 3: Data source and SQL analysis. Identify all database connections, SQL commands, stored procedures, and join logic that Crystal Reports currently uses. Determine which logic should move to the star schema semantic model and which should remain as source-layer SQL or Power Query.
Step 4: Star schema design. Build the Power BI semantic model with fact and dimension tables, defined relationships, and a library of shared DAX measures. Build this foundation before rebuilding individual reports.
Step 5: Formula conversion and report rebuild. Translate Crystal formulas to DAX, rebuild subreports as drill-through pages or related pages, redesign parameters as slicers and filters, and rebuild visuals: choosing interactive or paginated output for each report based on its purpose.
Step 6: Validation. Compare Power BI output against the original .rpt report: row counts, totals, calculated field values, filter behavior, and layout fidelity. Validate formula-heavy reports line by line before sign-off.
Step 7: Security, deployment, and adoption. Configure workspace permissions and row-level security. Deploy through Power BI deployment pipelines. Set up refresh schedules. Train users on Power BI's self-service capabilities, and run legacy Crystal Reports in parallel until each wave is validated and signed off.
Manual vs Automated Crystal Reports Migration
| Factor | Manual Migration | Automated Migration |
|---|---|---|
| .rpt analysis | Manual review of each report's layout and formulas | Automated parsing of .rpt structure and formula fields |
| Formula conversion | Field-by-field manual translation | Bulk conversion for standard formula patterns |
| Consistency | Varies by developer | Uniform naming and calculation logic |
| Complex formulas | High expert effort | Expert review still required |
| Best for | Small estates under 50 reports | Large estates with hundreds or thousands of reports |
Automation can accelerate .rpt discovery, metadata extraction, formula identification, SQL extraction, and structural conversion. Complex business logic, semantic model design, subreport redesign, and validation still require expert review. The most effective migrations combine automated analysis for scale with specialist engineering for accuracy.
Common Crystal Reports to Power BI Migration Challenges
- Pixel-perfect layout requirements: Crystal Reports' print-precise formatting requires Power BI paginated reports rather than interactive canvas reports. Not all Crystal layout behavior is fully reproducible even in paginated reports.
- Formula density: reports with dozens of nested Crystal formulas require careful, field-by-field translation to DAX to avoid calculation drift. A formula that looks correct on screen can produce different totals if the evaluation context differs.
- Embedded SQL commands: report-level SQL that bypasses a data layer must be redesigned as part of the semantic model rather than copied as-is into Power Query.
- Subreport nesting: deeply nested subreports require individual design decisions and are the most time-consuming migration component per report.
- Report sprawl: large Crystal Reports estates that grew unchecked make a complete, accurate inventory a significant project in itself before any conversion begins.
- Business logic hidden in reports: calculations and business rules embedded in Crystal formulas rather than in a data layer must be extracted and documented before migration; otherwise the logic is lost when the .rpt file is retired.
Crystal Reports to Power BI Migration Checklist
Before Migration
- Inventory all .rpt files in production
- Document data sources, SQL commands, formulas, and subreports per report
- Identify report owners, last-accessed date, and usage frequency
- Classify reports by complexity and migration target (paginated or interactive)
- Retire duplicate, obsolete, and zero-usage reports
During Migration
- Design Power BI star schema semantic model before rebuilding reports
- Build shared DAX measure library against the semantic model
- Translate Crystal formulas to DAX with context evaluation for each formula
- Redesign subreports as drill-through pages, related pages, or bookmarks
- Configure workspace permissions and Row-Level Security
Before Cutover
- Validate row counts, totals, and calculated field values against .rpt output
- Test filter, slicer, and parameter behavior
- Validate security with representative user accounts
- Obtain business sign-off before retiring legacy Crystal Reports
- Archive original .rpt files before decommissioning
Crystal Reports to Power BI Migration Services by DataTerrain
17 Years Experience | 400+ US Clients | .rpt to .pbix Conversion | Crystal Formula to DAX | Paginated Reports
DataTerrain is a specialist data engineering and analytics migration company that delivers end-to-end Crystal Reports to Power BI migration: report inventory and rationalization, star schema design, Crystal formula to DAX conversion, subreport redesign, paginated report build, parallel-run validation, and user adoption. Our Automated BI reports conversion service accelerates .rpt analysis and conversion at scale for organizations with large Crystal Reports estates.
Key Takeaways
- .rpt files cannot be directly imported into Power BI. Formulas, SQL, subreports, and layout must be analyzed and rebuilt for Power BI's architecture.
- Crystal Reports end of life in 2027 makes migration urgent. Crystal Reports 2020 ends mainstream maintenance in December 2026; Crystal Reports 2025 follows in December 2027.
- Build the star schema data model before converting reports. DAX measures defined once in a shared semantic model produce consistent results across all reports.
- Choose paginated or interactive based on purpose. Print-ready Crystal Reports suit Power BI Report Builder; analytical reports suit interactive .pbix dashboards.
- Subreports have no direct Power BI equivalent. Each requires an individual design decision: drill-through, tooltip, bookmark, or paginated subreport.
- Retire before migrating. A report inventory typically reveals duplicate and obsolete reports that should be retired, not rebuilt.
Final Thoughts on Crystal Reports to Power BI Migration
Crystal Reports to Power BI migration is a modernization project with a firm deadline. Organizations that start with a thorough report inventory, retire unused content before building, design the semantic model before converting individual reports, and translate Crystal formulas with proper context evaluation consistently achieve better outcomes than those treating migration as a one-to-one file conversion.
The Crystal Reports end-of-life 2027 timeline is fixed: planning now allows for a structured, phased approach rather than a rushed migration under time pressure.
Contact DataTerrain to discuss your Crystal Reports estate and build a migration plan before mainstream maintenance ends.
Related Articles
- Power BI Migration Services: The Complete Enterprise Guide
- Power BI Consulting Services: A Complete Enterprise Guide
- Microsoft Power BI vs SAP Crystal Reports: A Comprehensive Comparison
- BI Modernization Checklist: A Step-by-Step Guide for Enterprises