Contents
- 13 Nov 2026
Qlik to Tableau Migration: What Converts, What Gets Rebuilt
Moving from Qlik to Tableau is mostly a rebuild, not an automatic conversion. Data connections and the data behind QVD files can move across, and accelerators can inventory apps and draft first-pass logic. Load scripts, set analysis, selections, and section access must be re-expressed in warehouse SQL, Tableau Prep, calculated fields, and row-level security, and sheets are redesigned as Tableau worksheets and dashboards. Even with accelerators, expect engineering and validation, so inventory first, retire what nobody uses, and reconcile every key figure against Qlik before cutover.
If you searched for Qlik to Tableau conversion, the honest answer is that some parts convert and many parts do not. QlikView and Qlik Sense keep data loading, modeling, and visuals together in one app. Tableau separates them into data sources, data models, and workbooks. That structural difference, more than any single feature, decides how much work a migration needs.
This page shows how the two platforms map to each other, what converts and what needs a rebuild, the two questions that shape your plan, a step-by-step approach, and what governed and public sector teams should check. If you are still choosing a target, our Qlik migration services overview compares the main routes, and our Qlik to Power BI and Qlik to Microsoft Fabric articles cover those two in depth.
Quick Summary

- Share Post:
-

-

Key Takeaways
- Expect a rebuild. Parts convert, but the logic and the experience are redesigned.
- Logic is the risk. Load scripts, QVD layers, set analysis, and section access carry the business rules.
- Two questions shape the plan. Which Qlik product you run, and where your data lives.
- Sequence matters. Inventory, rationalize, design data sources, convert, rebuild, and validate.
- Proof beats speed. Reconcile every key figure against Qlik before users switch.
Qlik vs Tableau: The Conceptual Map
| Area | In Qlik | In Tableau |
|---|---|---|
| The file | App (.qvf or .qvw) | Workbook (.twb or .twbx) |
| A page | Sheet | Dashboard and worksheets |
| The data model | Associative model, QVD layers, load script | Published data sources, relationships, and Hyper extracts |
| Calculations | Set analysis and Qlik expressions | Calculated fields, level of detail expressions, and table calculations |
| Data preparation | Load script and the data load editor | Tableau Prep, or upstream in the warehouse |
| Row-level security | Section access | User filters, entitlement tables, or data policies |
| Distribution | NPrinting reports and email schedules | Subscriptions and alerts, plus a paginated tool for formatted output |
What this means for you: Use the table to translate your own inventory. Every row is a conversation with the team that owns it.
What Converts and What Needs a Rebuild
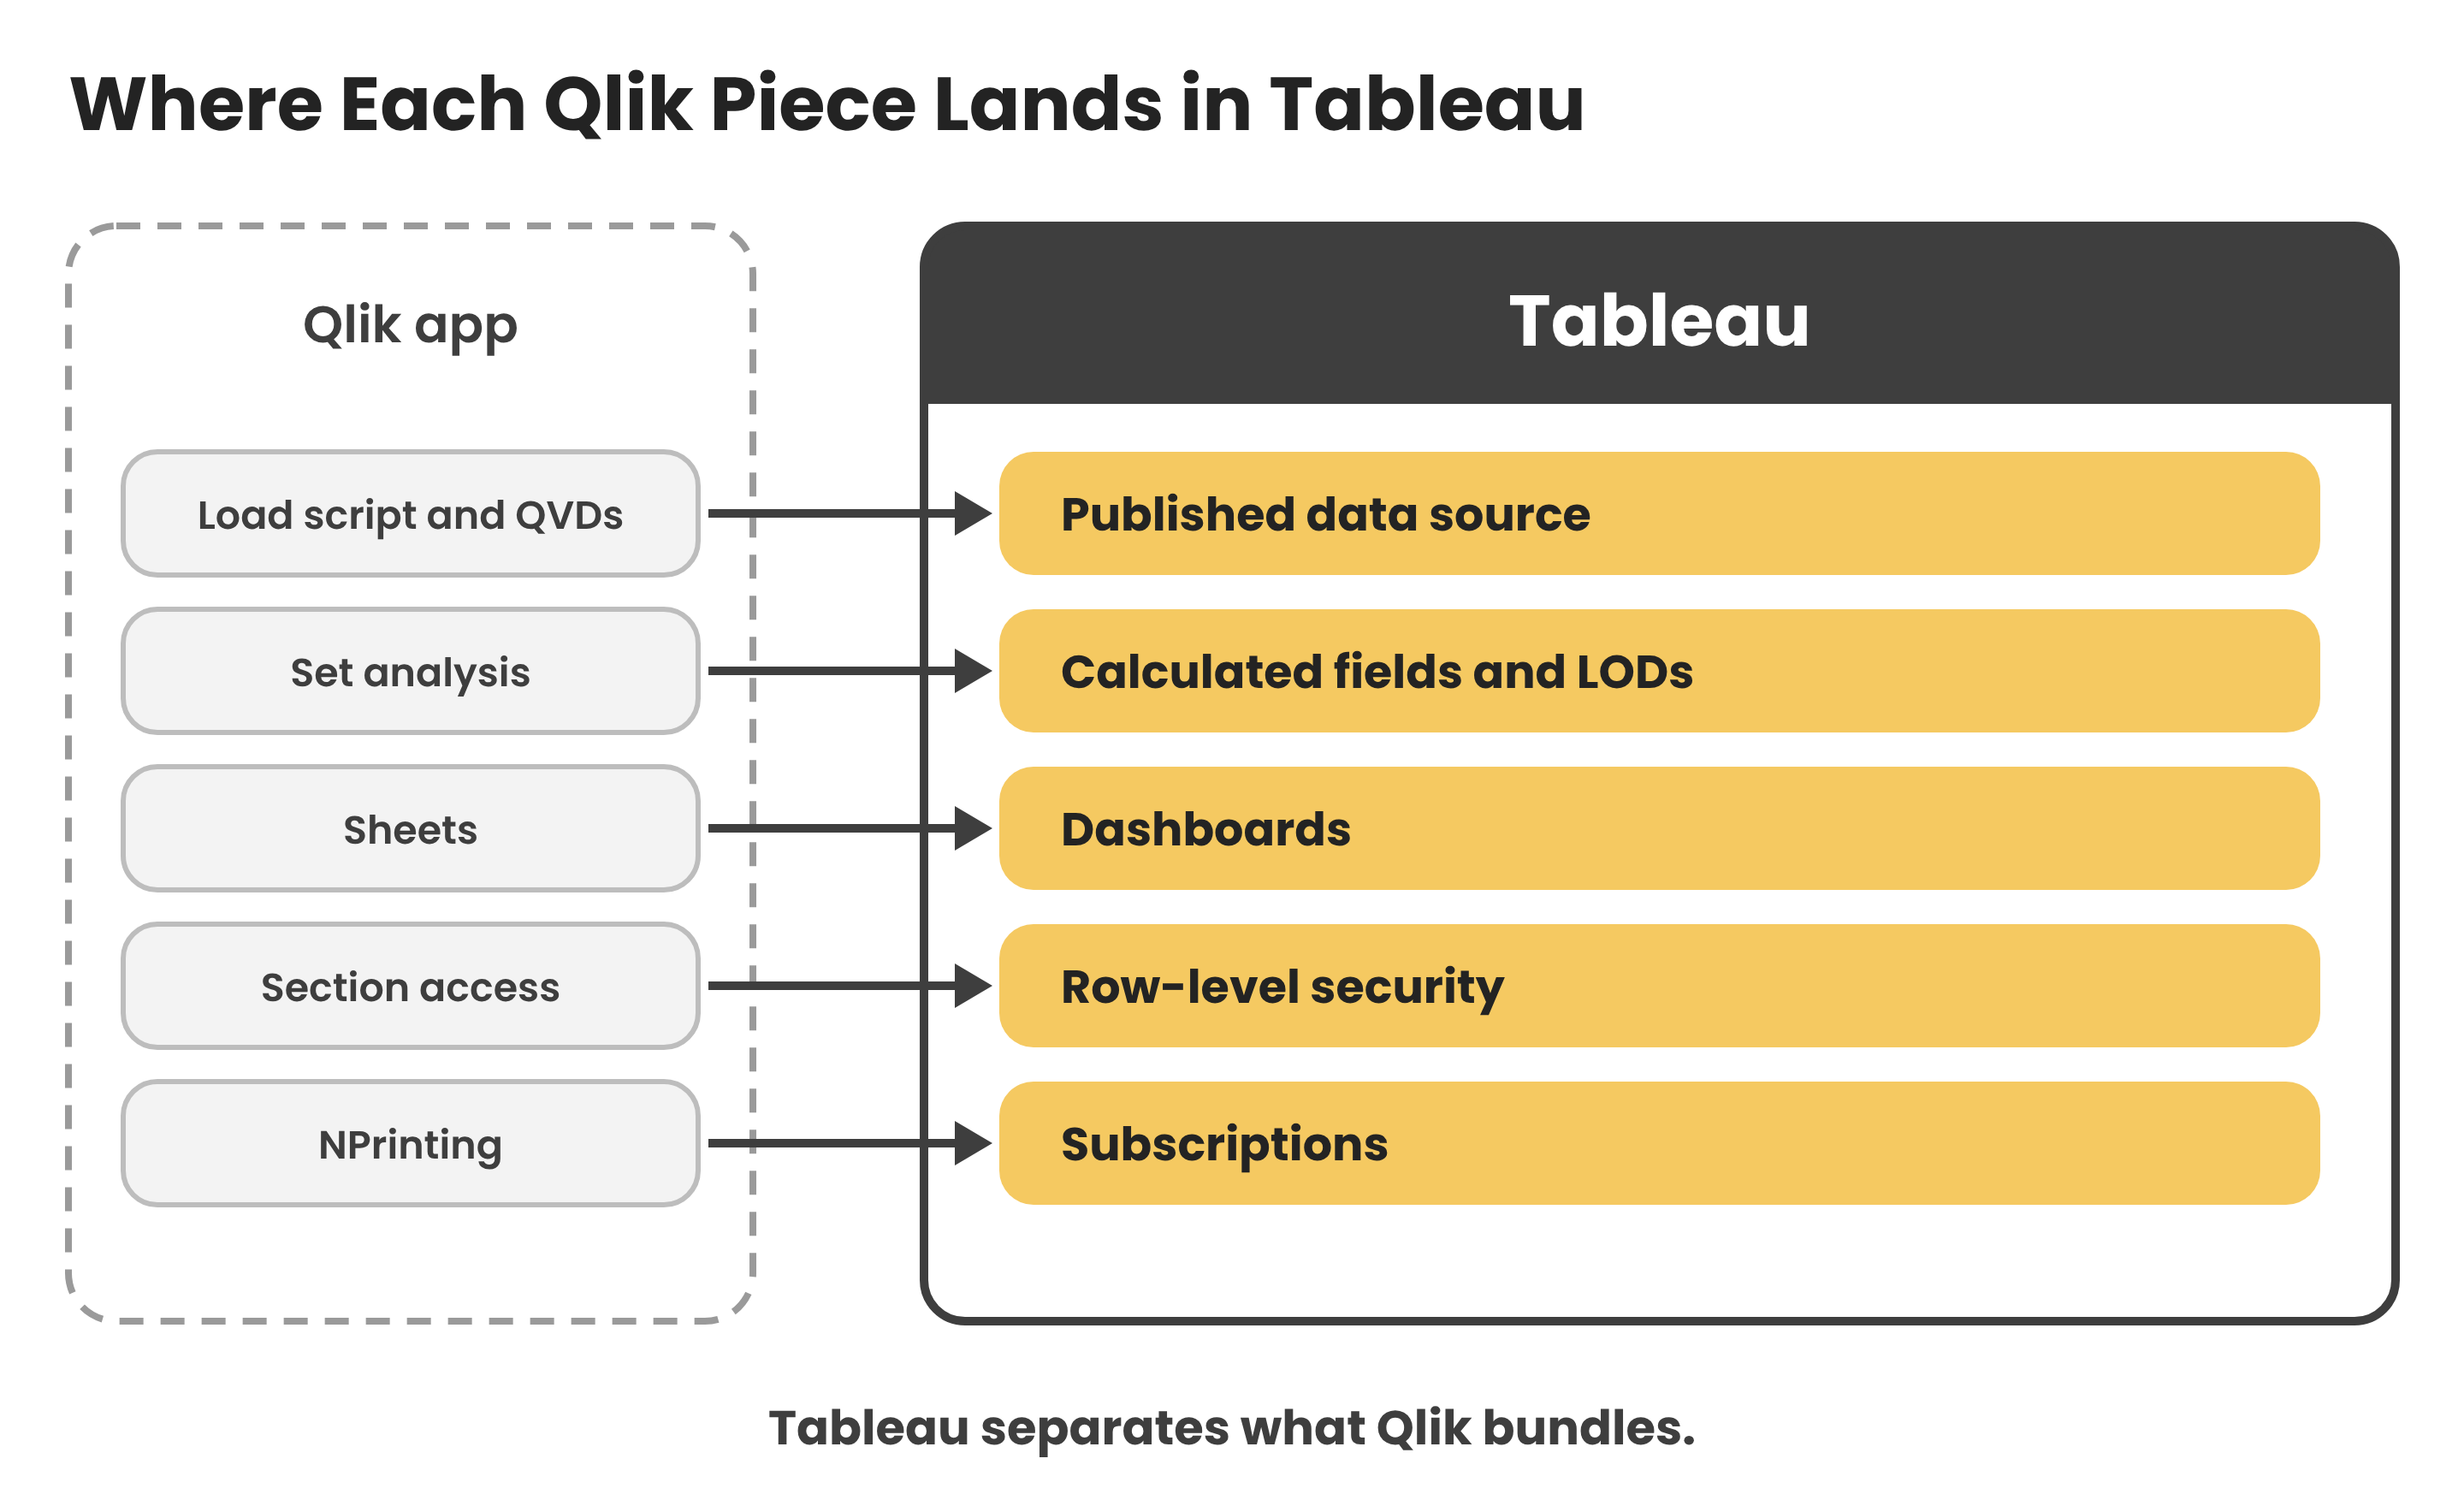
What usually moves across. Source connections, the underlying data (QVD content becomes warehouse tables or Tableau extracts), user and group lists, and a first inventory of what exists. Accelerators are strongest here, and they can also map script lineage and draft first-pass SQL or Prep logic for common patterns.
What needs human work. Calculations, because set analysis and Qlik expressions do not convert one-for-one. Load scripts with variables, loops, and incremental reloads need engineering review. Section access must be rebuilt and tested role by role.
What is redesigned. Qlik's green, white, and gray selection experience does not exist natively in Tableau. Interaction is rebuilt with filters, highlight actions, set actions, and parameters. Formatted, burst-distributed NPrinting reports usually split into dashboard snapshots delivered by subscription, and formatted output moves to a paginated reporting tool such as the ones described on our Jaspersoft reporting services page, because Tableau has no native pixel-perfect paginated reporting.
Searches for a free or one-click converter are common. In practice, most teams find that tools do not convert a Qlik app end to end without rework, and that automation helps most with inventory, lineage, and first-pass drafts. Our article on automated Qlik Sense migration describes what automation can and cannot do.
What this means for you: Budget for engineering and validation, and use automation to make them faster, not to skip them.
Two Questions That Shape Your Plan
Which Qlik product do you run?
QlikView estates tend to be older, with heavier load scripts, QVD layers, and bookmarks. They need the most re-architecture. Qlik says it has no plans to end-of-life QlikView, but individual releases expire. Version 12.90 ended support on October 31, 2026, and 12.100 is supported through September 30, 2027. Our article on QlikView vs Qlik Sense explains how the two differ.
Qlik Sense estates are usually newer and more modular, but they still carry set analysis, master items, and section access that must be rebuilt.
Where does your data live?
- In a cloud warehouse such as Snowflake, BigQuery, Databricks, or Redshift. Tableau connects live or by extract, and heavy transformation belongs in the warehouse. This is the easiest case.
- Mostly in Qlik scripts and QVD files. The transformation logic must be extracted first, and that usually makes the project an ETL migration before it is a BI migration.
- In files and spreadsheets. Land them in a governed store first, so Tableau is not rebuilding data preparation inside each workbook.
What this means for you: Answer both questions before you size the project. They change the cost more than the number of dashboards does.
A Step-by-Step Qlik to Tableau Plan
- Inventory and audit. Catalog every app, sheet, chart, script, QVD, and data source, with usage logs, so you can see what people open.
- Rationalize. Retire stale or unvisited content and merge near-duplicates. This is usually the biggest cost lever, and removing a large share of the workload is common.
- Choose the deployment. Decide among Tableau Cloud, Tableau Server, and newer offerings such as Tableau Next.
- Re-architect the data layer. Move heavy transformation upstream to the warehouse or Tableau Prep, and publish certified data sources, instead of replicating Qlik scripts line by line.
- Convert calculations with testing. Rewrite set analysis and expressions as calculated fields and level-of-detail expressions, and test each against baseline data.
- Rebuild the visuals. Redesign for Tableau's strengths in guided visual storytelling and structured flows, not a one-to-one visual clone. Our Tableau consulting services page covers the build side.
- Rebuild security, then validate. Re-implement section access with user filters, entitlement tables, or data policies, test with real accounts, and run both platforms in parallel until figures match.
Our enterprise BI migration services and reports conversion pages describe how we run this process.
Set Analysis: Re-Express, Do Not Translate
Set analysis lets a Qlik expression define its own selection state, for example by ignoring the user's selection on one field while honoring all the others. Tableau reaches results through a fixed order of operations across filters, level-of-detail expressions, and table calculations. A symbol-by-symbol translation can look right on one view and drift on the next.
The classic trap is a "FIXED" level of detail expression. It is evaluated before ordinary dimension filters, so it ignores all of them, not only the one you meant to override. Qlik's modifier often ignores a single selection and keeps the rest. Matching that can need context filters, extra dimensions, or a redesigned calculation. So document what each expression means in business terms, rebuild it, and compare outputs under the same filter combinations.
What this means for you: Test set analysis against Qlik under many selections, not just on the default view.
Are QlikView and Tableau Still Relevant?
Two questions come up constantly, so here are direct answers.
QlikView. It remains in use, and Qlik says it has no plans to end it, but each release has a support window. Estates on older releases face a choice to upgrade, move to Qlik Sense or Qlik Cloud, or migrate elsewhere.
Tableau. Salesforce continues to invest in it. Tableau Pulse delivers AI-driven metric summaries; its assistant is now called Tableau Agent, and Tableau Next is a separate agentic platform that requires Salesforce Data Cloud, with the newest capabilities reportedly requiring higher bundles. Confirm current availability with Tableau before planning around any AI feature.
Relevance is not the same as fit. The right platform depends on your data stack, your users, and your governance needs, and our Tableau vs Power BI and Qlik vs Power BI comparisons help if you are still weighing options. AI assistants also raise the stakes on governed data, because they answer from whatever definitions they find, so published, certified data sources are worth building well.
Public Sector and Government Considerations
This section is planning guidance, not a statement of DataTerrain's authorization status or government work. If Qlik Cloud Government or an on-premises Qlik estate satisfies your authorization boundary today, the new platform must meet it too:
- Authorization. Salesforce has announced FedRAMP High authorization for Tableau Next, and Tableau Government Cloud is reported at the FedRAMP Moderate level. Confirm the exact edition, region, and features with Tableau, since authorization covers named services.
- Deployment control. Tableau Server can run on-premises or in a cloud you control, which may help with residency and change-control rules.
- Row-level security and audit. Rebuild and test every rule, and keep logs, as our guides to migrating row-level security and data security compliance explain.
- Records and timing. Preserve app definitions, scripts, and reload history before decommissioning, and let renewal and approval cycles set the schedule.
What this means for you: Confirm the authorization boundary first, because it can rule a deployment option in or out.
Best Practices for a Low-Risk Move
- Rationalize before you migrate, so you never rebuild what nobody uses.
- Design data sources and security first, before the first dashboard.
- Pilot one visible, low-risk app, and learn from it.
- Redesign for Tableau, instead of copying Qlik sheets pixel by pixel.
- Document each expression's meaning before you convert it.
- Automate KPI reconciliation, and run it on every refresh during the parallel run.
- Run both platforms through a full business cycle, including month-end.
- Train users early, because the selection model changes.
- Plan performance tuning after the move too, using aggregated extracts and lighter dashboards.
Frequently Asked Questions
Scope Your Qlik to Tableau Migration with DataTerrain
The costly mistake is rebuilding screens first and discovering later that the logic behind them doesn't translate. DataTerrain brings 17+ years and 400+ clients in BI and reporting modernization, with automated assessment, logic conversion, and figure-for-figure validation against the numbers your users already trust.
Related Reading
Cognos vs Tableau | Tableau vs Microsoft Fabric | Tableau New Features and Innovations | Tableau to Power BI Migration | Benefits of Qlik Sense for Modern Analytics | Data Lake