Contents
- 19 Aug 2026
Qlik to Power BI Migration: The Complete Guide for BI Platform Modernization
Qlik to Power BI migration means moving apps, dashboards, data models, calculations, and security logic from QlikView or Qlik Sense into Power BI. It's not a file conversion; Qlik's associative model has to be redesigned around Power BI's semantic model, Power Query, and DAX. Done with the right automation and validation approach, migrations can be completed 70–80% faster than a fully manual rebuild. This guide covers why enterprises migrate, how Qlik assets map to Power BI, what drives cost and timeline, and how to plan a phased migration that stays on schedule.
What Is Qlik to Power BI Migration?
Qlik to Power BI migration is the process of moving apps, dashboards, data models, calculations, transformations, and security configurations built in QlikView or Qlik Sense into Microsoft Power BI.

- Share Post:
-

-

It is not a file conversion.
Qlik's associative engine allows users to explore relationships across data through selections and associations. Power BI, by contrast, uses a tabular semantic model with explicit relationships, measures, and filtering behavior.
That difference makes the data-model redesign one of the most important parts of a migration. Microsoft recommends star-schema modeling for Power BI semantic models because dimension tables support filtering and grouping while fact tables support summarization. (Microsoft Learn)
In practice, a Qlik migration typically involves:
- Rebuilding the Qlik data model as a Power BI semantic model
- Translating Qlik load scripts into Power Query/M or an upstream ETL layer
- Rewriting Qlik expressions and set analysis as DAX
- Rebuilding Section Access as Power BI Row-Level Security
- Recreating dashboards and user interactions
- Rebuilding bookmarks and drill paths
- Replacing or redesigning Qlik extensions and macros
- Validating Power BI reports against the original Qlik applications
Qlik applications are also frequently supported by QVD files, Qlik's proprietary data format. During migration, those data dependencies need to be assessed and either replaced, retained as an interim source, or moved into an appropriate enterprise data platform.
Migration paths generally point to Power BI deployed through the Power BI Service or Microsoft Fabric. Organizations that require broader data engineering, warehousing, and analytics capabilities may choose Fabric alongside Power BI.
Both QlikView to Power BI and Qlik Sense to Power BI follow the same broad migration pattern, although legacy QlikView applications may require additional remediation for macros, document-specific logic, and older extensions- the kind of legacy rework covered in our guide to legacy scripts migration.
Why Enterprises Migrate from Qlik to Power BI
Several recurring factors drive organizations to move from Qlik to Power BI. Microsoft ecosystem integration is the most common: organizations standardized on Microsoft 365, Teams, Azure, and Fabric often find Power BI fits more naturally into their existing environment, reducing platform fragmentation and connector licensing for teams already invested in the BI reports and dashboard development side of that ecosystem. Licensing and total cost of ownership also factor in, particularly for organizations already paying for Microsoft 365 bundles that include Power BI Pro; the right comparison should weigh the organization's complete BI environment, not license price alone. Built-in AI and Copilot capabilities are a growing driver, letting teams introduce natural-language analytics and AI-assisted report development without adopting a separate AI toolchain. And talent and skills availability matter more than they first appear: DAX and Power Query are more widely taught than Qlik's load scripting and set analysis, which affects hiring, onboarding, training, and long-term platform maintenance.
Qlik vs Power BI: Side-by-Side Comparison
| Criteria | Qlik Sense | Power BI |
|---|---|---|
| Core Engine | Associative Engine (QIX); in-memory analytics | VertiPaq columnar engine with DAX; optional DirectQuery |
| Data Model | Associative model; relationships inferred through shared fields | Tabular semantic model with explicit relationships |
| Filtering | Global selections across the application | Slicers, filters, cross-filtering, and relationships |
| Security | Section Access | Row-Level Security using roles and DAX |
| Page-Level Visibility | Expression-driven show/hide capabilities | Navigation and report design mechanisms |
| Deployment | Qlik Cloud or Qlik Sense Enterprise | Power BI Service or Microsoft Fabric |
| AI Features | Qlik AI capabilities, including Qlik Answers where available | Microsoft Copilot and broader Microsoft AI ecosystem |
| Best Fit | Associative exploration across complex, multi-source data | Microsoft-standardized analytics and enterprise semantic modeling |
The comparison is not simply about which platform has more features. It is about which architecture better fits the organization's data strategy, workforce, governance model, and technology ecosystem, a decision our data analytics services work often starts with.
QlikView vs Qlik Sense Migration to Power BI
Both QlikView and Qlik Sense can be migrated to Power BI, but the complexity of an individual migration depends heavily on the application's architecture and legacy dependencies.
| Area | QlikView | Qlik Sense |
|---|---|---|
| Applications | Documents/apps | Apps |
| Data Scripting | Qlik load script | Qlik load script |
| Expressions | Set analysis and Qlik expressions | Set analysis and Qlik expressions |
| Security | Section Access | Section Access |
| Extensions | Legacy/custom objects may require remediation | Extensions and custom visualizations |
| Macros | May require additional assessment | Application-specific logic may require assessment |
| Migration Target | Power BI semantic model + reports | Power BI semantic model + reports |
| Key Consideration | Legacy logic and macros | App architecture, extensions, and scripting |
The migration target is broadly similar, but assessment should account for the Qlik version, application architecture, scripting complexity, extensions, security implementation, and business-critical logic.
Qlik to Power BI Asset Mapping
A practical reference for what each Qlik asset typically maps to on the Power BI side:
| Qlik Asset | Power BI Equivalent | Migration Notes |
|---|---|---|
| Qlik app | Power BI report | Rebuilt natively |
| Associative data model | Star-schema semantic model | Structural redesign |
| Qlik load script | Power Query/M | Transformation logic reimplemented |
| Expression/set analysis | DAX measure | Requires logic translation |
| Section Access | RLS role | Different security model |
| Global selection | Slicer / cross-filter | User experience changes |
| Qlik bookmark | Power BI bookmark | Recreated manually |
| Alternate state | Filters, bookmarks, or redesigned interaction | No direct one-to-one equivalent |
| Drill-down | Power BI drill-down | Recreated |
| Qlik extension | Native/custom Power BI visual or redesigned interaction | Depends on extension |
| Qlik space/stream | Power BI workspace | Governance model differs |
| QVD | Power BI data source/data platform | Depends on target architecture |
The objective is not to create a one-to-one technical copy of every Qlik feature. The objective is to preserve the business outcome and analytical capability while leveraging Power BI's native architecture.
Qlik to Power BI Migration Process
Treat a successful migration as a structured modernization program, not a sequence of report conversions. The ten steps below fall into four broader phases:
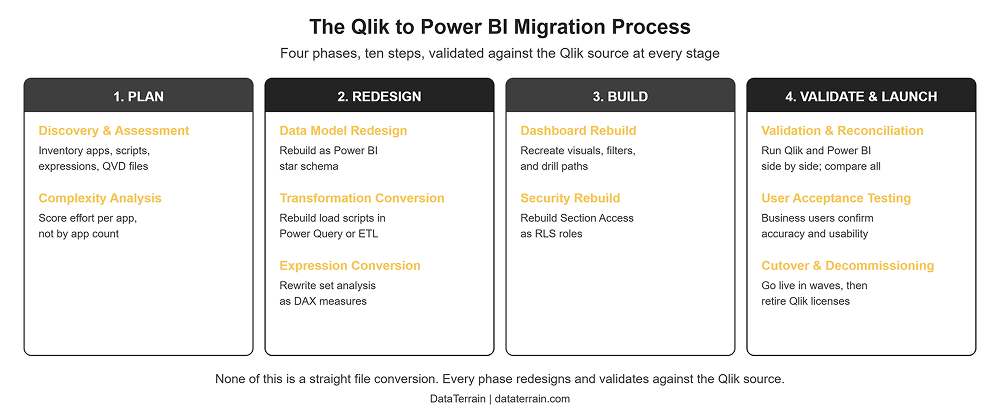
Figure: The Qlik to Power BI Migration Process — Plan, Redesign, Build, Validate & Launch
- Discovery and Assessment. Start by inventorying the Qlik environment: QlikView and Qlik Sense applications, dashboards and sheets, load scripts, QVD dependencies, data sources, expressions, set analysis, Section Access rules, extensions, macros, bookmarks, drill paths, user groups, and usage patterns. Microsoft's Power BI migration guidance also emphasizes preparing an inventory of existing reports, defining success criteria, establishing architecture, and exploring automation options before migration begins. (Microsoft Learn)
- Dependency and Complexity Analysis. Not every Qlik application requires the same amount of effort. Assess the number of data sources, script complexity, number of expressions, nested set analysis, custom extensions, security complexity, data volumes, application dependencies, and business-critical calculations. This lets migration teams estimate effort based on complexity rather than simply counting applications.
- Data Model Redesign. Redesign the associative model as a Power BI semantic model. A typical target architecture separates fact tables, dimension tables, measures, relationships, and business definitions. Microsoft recommends star-schema principles for Power BI semantic models because the design supports effective filtering, grouping, and summarization. (Microsoft Learn) For large or complex transformation requirements, organizations may also move data preparation into a dedicated warehouse or ETL layer instead of reproducing every transformation in Power Query. (Microsoft Learn)
- Data Transformation Conversion. Rebuild Qlik load-script transformations using Power Query/M or an upstream ETL process. This may include joins, filters, derived fields, aggregations, data cleansing, incremental loading, and data type transformations. Assess complex transformation logic individually rather than reproducing it mechanically.
- Calculation and Expression Conversion. Rewrite Qlik expressions and set analysis as DAX. The goal is to reproduce the business meaning, not simply translate syntax. Validate each calculation for filter context, aggregation behavior, time intelligence, conditional logic, null handling, and business rules.
- Report and Dashboard Rebuild. Recreate Qlik sheets and dashboards using Power BI visuals and native interactions: charts, tables, KPI cards, filters, slicers, drill-down, drill-through, bookmarks, navigation, and tooltips. Where Qlik functionality has no direct Power BI equivalent, redesign the interaction around the user's business requirement, using the same design discipline behind our BI reports and dashboard development.
- Security Rebuild. Translate Qlik Section Access requirements into Power BI security roles. Test every security rule against representative user accounts. Do not validate security using only administrator accounts.
- Validation and Reconciliation. Run the original Qlik application and new Power BI report in parallel. Compare record counts, KPIs, aggregations, filters, calculated values, data refresh results, user permissions, drill paths, and critical business outputs. Microsoft's migration guidance recommends using a proof of concept to test areas where the legacy platform and Power BI differ and to identify architecture changes early. (Microsoft Learn)
- User Acceptance Testing. Business users should validate critical reports before production cutover. Testing should confirm both data accuracy and business usability. A report can technically match its source while still requiring redesign if users cannot perform their workflows effectively in the new environment.
- Cutover and Decommissioning. Move approved applications into production in controlled waves. Keep the Qlik environment available during the validation period, then retire applications and licenses after successful sign-off.
Migration Effort by Component
Knowing what maps to what only answers half the planning question. The other question is how much effort each component requires.
| Qlik Component | Typical Migration Effort | Why |
|---|---|---|
| Load script (joins, transformations) | Moderate | Reimplemented in Power Query/M |
| Simple aggregation expressions | Low | Often maps to straightforward DAX |
| Nested set analysis | High | Requires business-logic translation |
| Section Access | Moderate to High | Rebuilt and tested as RLS |
| Global selections | High | Requires interaction redesign |
| Custom Qlik extensions | High | May require custom visuals or redesign |
| Macros | High | May have no direct equivalent |
| Bookmarks | Low | Recreated manually |
| Drill-down | Moderate | Recreated using Power BI interaction patterns |
| Alternate states | Moderate to High | Requires redesign rather than direct conversion |
Scoping a migration using component complexity rather than application count alone produces more realistic estimates. Two applications with the same number of sheets can require dramatically different effort if one contains simple aggregations while the other contains nested set analysis, macros, extensions, and complex Section Access.
Migration Challenges
The Associative Model Shift
The biggest adjustment is architectural. Qlik users are accustomed to associative exploration, where selections can reveal relationships across the application's data. Power BI relies on explicit relationships and a semantic model. The migration therefore requires redesigning how users interact with the data, not simply rebuilding the same screens. Trying to make Power BI behave exactly like Qlik can produce unnecessarily complex reports.
Qlik Set Analysis to DAX Conversion
Qlik expressions and set analysis need to be rewritten as DAX. This is usually one of the most resource-intensive parts of a migration because the calculation logic and filter behavior differ between the platforms. The challenge is not syntax conversion alone. The migration team must understand what the calculation is intended to measure and then reproduce that business logic using Power BI's calculation and filter context, the same discipline behind our approach to BI automation for report migration.
Qlik Script Rewrite as Power Query
Qlik load scripts need to be translated into Power Query/M or moved upstream into a data integration layer. Qlik's scripting environment and Power Query have different syntax and execution models. For complex, high-volume transformations, a better target may be an enterprise ETL or data warehouse layer rather than reproducing every transformation in Power Query. Microsoft similarly notes that Power Query can become challenging with large data volumes or advanced transformation requirements and recommends considering a warehouse and ETL processes in those situations. (Microsoft Learn)
Losing the Global Selection Model
Users accustomed to Qlik's associative selections may initially find Power BI's interaction model different. The answer is not to recreate every Qlik interaction exactly. Instead, redesign slicers, cross-filtering, drill-through, bookmarks, page navigation, report-level filters, and semantic-model relationships around the user's analytical workflow.
Security Differences
Qlik Section Access and Power BI Row-Level Security are not identical. Document and redesign security requirements; don't copy them. Validate every role against representative user accounts before production.
Custom Extensions and Macros
Custom Qlik extensions and macros can introduce significant migration effort. Some can be replaced with native Power BI features. Others may require custom visuals, Power BI-supported alternatives, new report interactions, application redesign, or retirement where the underlying business requirement is no longer necessary.
How Much Does Qlik to Power BI Migration Cost?
There is no reliable single price for a Qlik to Power BI migration because cost depends heavily on application complexity, not application count alone.
Key cost drivers include: number of QlikView and Qlik Sense applications, number of dashboards and sheets, load-script complexity, QVD dependencies, number of data sources, set analysis complexity, DAX conversion requirements, Section Access and RLS requirements, extensions and macros, dashboard redesign, data-model redesign, validation requirements, user acceptance testing, migration timeline, and required Power BI or Fabric architecture.
A useful migration estimate should therefore be based on application complexity, dependencies, and business criticality, rather than a simple per-dashboard calculation. A representative Proof of Concept can help establish the actual conversion effort before committing to a full migration.
How Long Does a Qlik to Power BI Migration Take?
Migration timelines vary significantly based on application complexity, data architecture, number of reports, and validation requirements. A focused migration of business-critical applications can often take several weeks, while larger enterprise migrations may take several months.
The primary timeline drivers are application inventory size, set analysis complexity, data-model redesign, load-script conversion, number of data sources, security requirements, custom extensions, validation scope, user acceptance testing, and number of migration waves.
For planning purposes, a focused migration of business-critical applications may run approximately 8–16 weeks, while larger enterprise programs can extend beyond that range. The most reliable way to establish a timeline is to assess a representative sample of applications rather than estimating solely from total application count.
Quick Recap
- Qlik to Power BI migration is a platform modernization and redesign exercise, not a file conversion.
- Qlik's associative data model typically needs to be redesigned as a Power BI semantic model using explicit relationships and star-schema principles.
- Qlik load scripts generally need to be rebuilt in Power Query/M or an appropriate upstream ETL layer.
- Qlik expressions and set analysis need to be rewritten as DAX.
- Section Access needs to be redesigned and validated using Power BI security capabilities such as RLS.
- Custom Qlik extensions and macros may require significant redesign.
- Simple aggregations and repetitive migration activities offer greater automation potential than complex business logic.
- Migration cost and timeline depend more on application complexity than application count alone.
- A phased migration with parallel validation reduces cutover risk.
- An automation-assisted approach can reduce migration time substantially; in suitable projects, it can deliver 70–80% faster execution than a fully manual rebuild, depending on scope and complexity.
- A representative Proof of Concept is one of the best ways to establish actual migration effort before scaling.
Migrate from Qlik to Power BI with DataTerrain
Qlik-to-Power BI migration succeeds or stalls based on how well the associative-to-star-schema shift is planned, not simply how quickly files are rebuilt. Getting the target semantic model right, scoping DAX conversion honestly, redesigning Qlik-specific interactions, rebuilding security, and validating every report against its Qlik source before cutover are what separate a migration that stays on schedule from one that does not.
With 17+ years of experience in BI migration and automation, 400+ customers, and 27,000+ reports and dashboards delivered, DataTerrain's Qlik to Power BI consulting services cover the migration lifecycle, including Qlik application assessment, star-schema redesign, data-model modernization, Qlik expression and DAX conversion, Power Query/M transformation, RLS implementation, dashboard redevelopment, migration automation, parallel validation, and phased deployment.
Every DataTerrain migration starts with a free Proof of Concept. A representative sample of your actual Qlik applications can be assessed and converted so your team can evaluate the migration approach against its own environment before committing to the full project. Automation-assisted migrations can reduce repetitive migration work substantially, with suitable projects achieving 70–80% faster execution than fully manual rebuilds, depending on application complexity and validation requirements. Fixed-cost scoping can also provide greater cost predictability during the migration.
Request a Free Proof of Concept.
Related Reading
Key Checklist for Successful BI Modernization | From Any to Any: How BI Automation Simplifies Report Migration | BI Reports and Dashboard Development | How Enterprises Can Benefit from Automated Shifts from Legacy BI to Modern BI | Amazon QuickSight vs Tableau: Key Differences | Reports Conversion Services | Legacy Scripts Migration