Contents
- 21 Aug 2026
Power BI Dashboard Migration: The Complete Guide
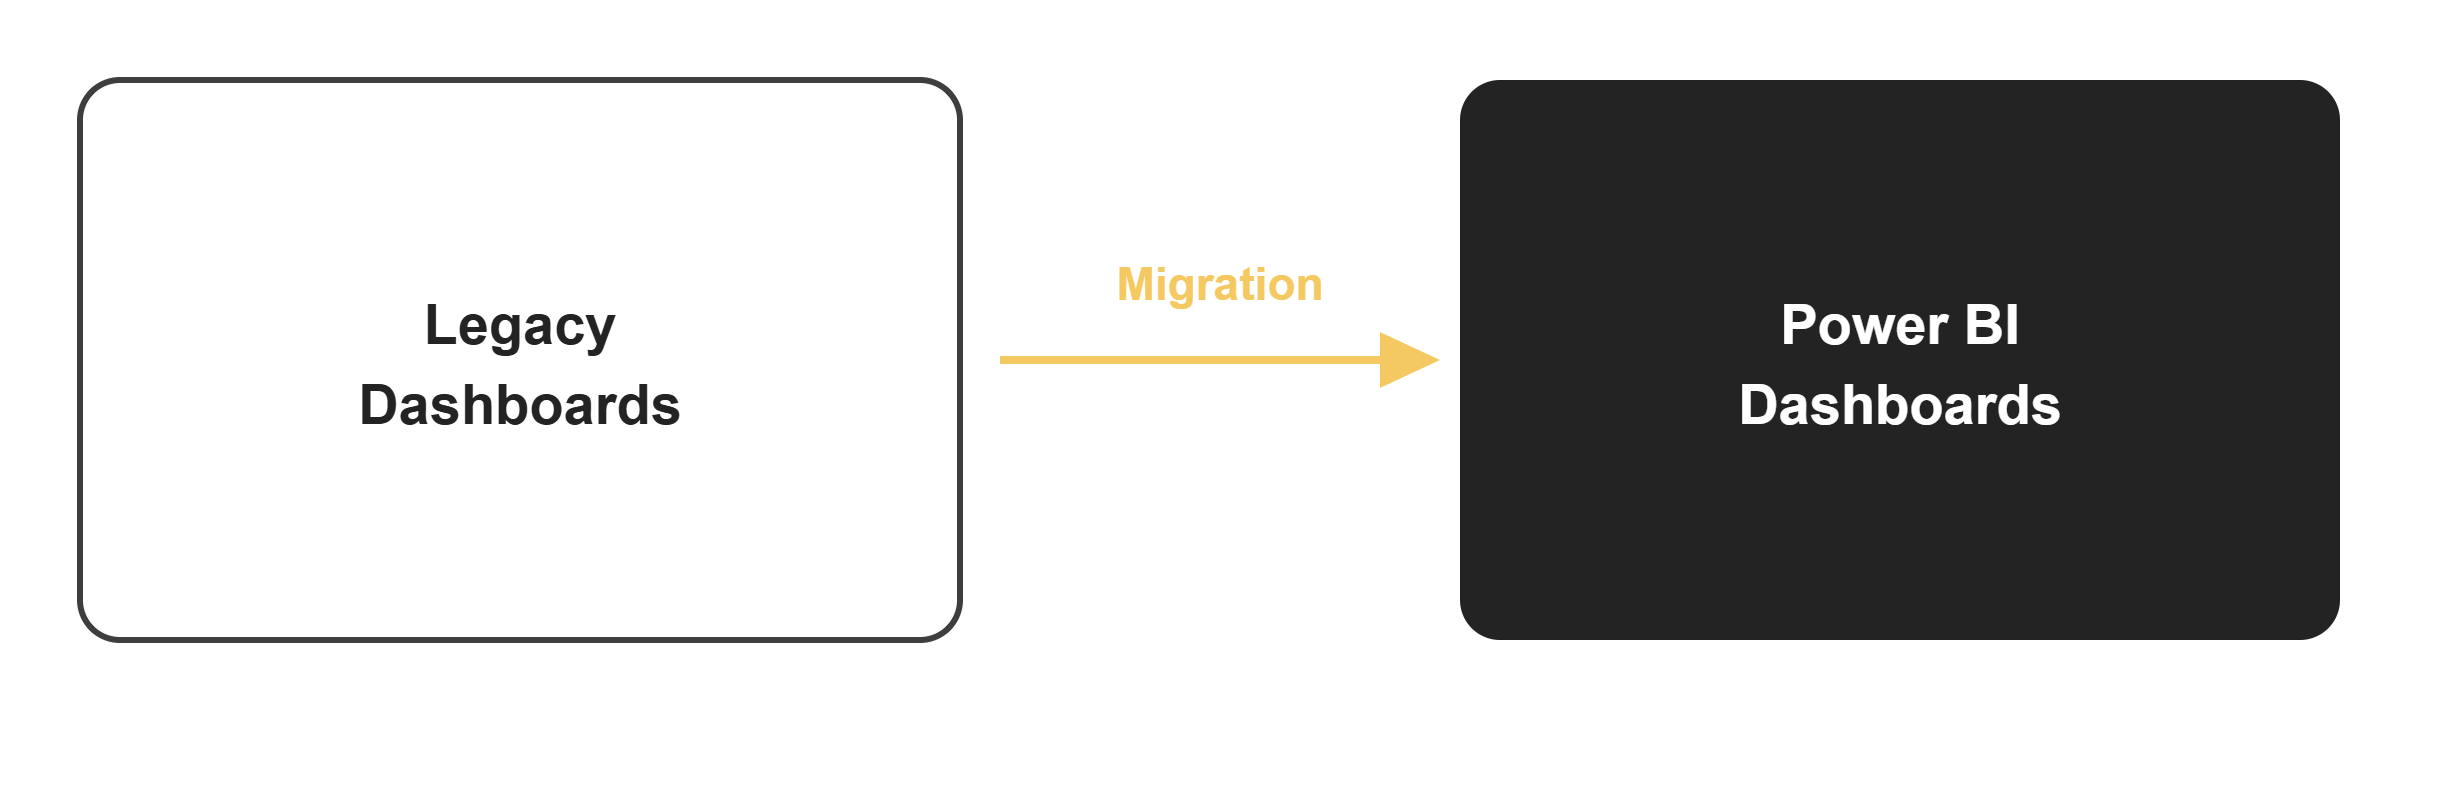
Figure 1: Rebuilding legacy dashboards and KPIs as interactive Power BI reporting
Legacy dashboards: whether built in Tableau, Cognos, QlikView, or older Power BI workspaces, accumulate KPIs, filters, and tiles over years, often without a clear owner. Migrating dashboards to Power BI is not a lift-and-shift; it is a rebuild that touches the semantic model, the visuals, and the workspace structure at once. This guide walks through what a Power BI dashboard migration involves, from inventory through rollout, covering assessment, semantic model rebuild, Tableau-to-Power BI conversion, DAX migration, workspace setup, validation, and a migration checklist.
Power BI Dashboard Migration at a Glance

- Share Post:
-

-

| Migration Area | What Happens |
|---|---|
| Dashboard inventory | Identify active dashboards, reports, KPIs, owners, users, and dependencies |
| Complexity assessment | Classify dashboards as simple, moderate, or complex to prioritize and estimate effort |
| Data sources | Identify, assess, and connect all databases, files, APIs, and cloud sources |
| Semantic model | Rebuild the Power BI data model with fact/dimension tables, relationships, and measures |
| KPI and DAX conversion | Convert legacy calculations into Power BI measures using DAX |
| Visual rebuild | Recreate charts, cards, tables, slicers, and dashboard tiles natively in Power BI |
| Workspace and security | Set up Power BI workspace structure, roles, and Row-Level Security |
| Validation | Compare data, KPI calculations, visuals, filters, and security against the legacy environment |
| Deployment and monitoring | Publish, transition users, and monitor refresh, usage, and performance |
What is Power BI Dashboard Migration?
Power BI dashboard migration is the process of converting dashboards, KPIs, and visualizations from a legacy BI tool: Tableau, Cognos, QlikView, or an outdated Power BI environment into a rebuilt Power BI semantic model and dashboard set, including workspace setup, tiles, filters, and security.
- Source dashboard tiles and visuals → Power BI report visuals and pinned dashboard tiles
- KPIs and scorecards → Power BI KPI visuals and DAX measures
- Underlying data sources → a rebuilt Power BI semantic model
- Access groups → Power BI workspace roles and Row-Level Security (RLS)
Not every dashboard component has a one-to-one equivalent in Power BI. Calculations, interactions, filters, security rules, and visual behaviors must be redesigned or rebuilt rather than copied directly.
Why Migrate Dashboards to Power BI?
Real-Time and Scheduled Data Refresh
Power BI's scheduled and DirectQuery refresh options replace static or manually refreshed legacy dashboards, keeping KPIs current without manual exports or spreadsheet consolidation.
AI-Assisted Insights
Power BI's Copilot and Q&A capabilities let business users ask natural-language questions of dashboard data: a capability most legacy dashboard tools do not offer natively. Availability depends on licensing tier and tenant configuration.
Microsoft 365 Collaboration
Power BI workspaces integrate directly with Microsoft Teams and SharePoint, making dashboard sharing and discussion part of the existing Microsoft 365 workflow rather than a separate tool.
Centralized Semantic Models
A shared Power BI semantic model provides consistent measures and business definitions reused across multiple reports and dashboards, eliminating inconsistent KPI logic scattered across individual dashboard tiles.
Self-Service Analytics and Dashboard Modernization
Migration is an opportunity to retire redundant dashboards, consolidate near-duplicates, and redesign outdated visualizations rather than simply reproducing legacy layouts in a new tool.
Dashboard Types and Power BI Equivalents
| Legacy Dashboard Element | Power BI Equivalent | Notes |
|---|---|---|
| Tableau worksheet/dashboard | Power BI report page | Visual-by-visual rebuild, not a direct import |
| Tableau calculated field | Power BI DAX measure or column | Logic needs functional validation, not just syntax conversion |
| Tableau LOD expression | DAX measure or model logic | Requires functional conversion and output validation |
| Tableau parameter | Power BI parameter or slicer | Implementation depends on the specific use case |
| KPI scorecard | Power BI KPI visual or card visual | Target vs actual logic rebuilt as DAX measures |
| Cross-filter or action filter | Power BI cross-highlighting or slicers | Filter behavior reconfigured, not copied |
| Drill-down hierarchy | Power BI drill-through pages | Rebuilt using drill-through target pages |
| Pinned tiles (legacy dashboard) | Power BI dashboard tiles | Pinned from underlying report visuals |
| Access groups or permissions | Power BI workspace roles and RLS | Mapped role-by-role, tested individually |
Pre-Migration: Dashboard Inventory and Complexity Tiers
A Power BI dashboard migration assessment identifies which dashboards, reports, KPIs, data sources, calculations, and security rules need to be rebuilt before migration begins. Before any rebuild, inventory every dashboard in use and classify it by complexity:
| Tier | Characteristics | Migration Approach |
|---|---|---|
| Simple | Single data source, few visuals, no drill-through | Rebuild quickly; good for a pilot batch |
| Moderate | Multiple sources, filters, some KPIs | Rebuild after semantic model is in place |
| Complex | Drill-through, RLS, cross-filtering, many tiles | Rebuild last, with dedicated testing |
Usage data matters as much as complexity. Dashboards with no views in months are better retired than migrated. Migration is the right time to reduce dashboard sprawl, not reproduce it.
Step-by-Step Power BI Dashboard Migration Process
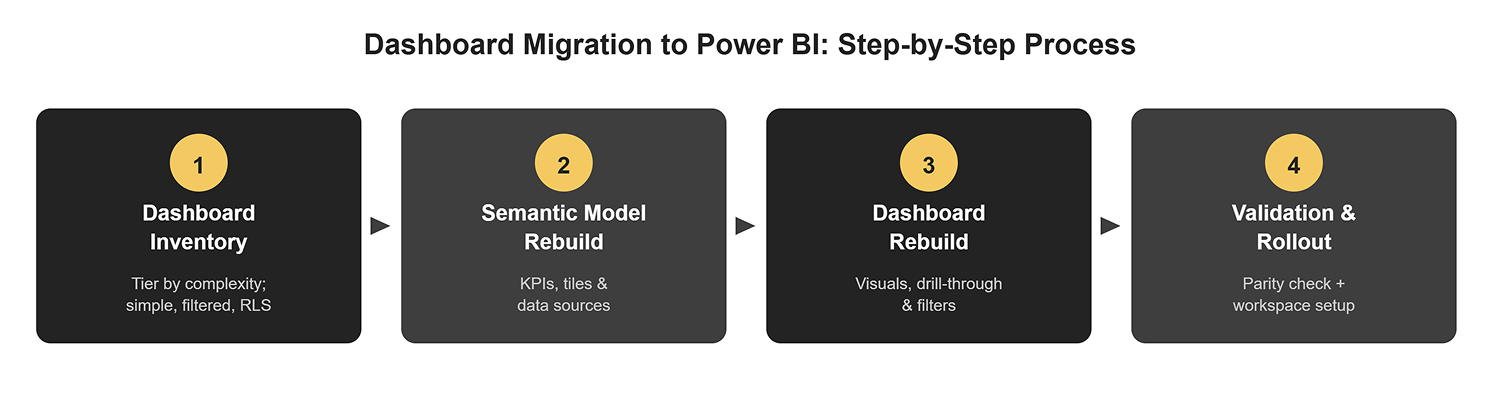
Figure 2: The four-stage dashboard migration lifecycle
- Dashboard Inventory. Catalog every dashboard, tile, and KPI in use, tiered by complexity as above, with usage data to prioritize what actually gets rebuilt.
- Semantic Model Rebuild. Rebuild the underlying data sources as a shared Power BI semantic model, so KPIs and measures are defined once and reused across dashboards rather than per tile.
- Dashboard Rebuild. Recreate visuals, filters, and drill-through logic natively in Power BI, then pin key visuals into dashboard tiles.
- Validation and Rollout. Compare KPI values and filter behavior against the legacy dashboard, set up Power BI workspaces and access roles, then roll out to business users.
Power BI Semantic Model Rebuild
A successful Power BI dashboard migration should rebuild the semantic model before recreating dashboard visuals. The semantic model is the governed data layer that all Power BI reports and dashboards build on: inconsistencies at this layer propagate to every KPI and visual above it.
A well-structured Power BI semantic model includes a clean star schema with distinct fact and dimension tables, explicit relationships with correct cardinality, a library of reusable DAX measures with consistent business definitions, calculated columns where appropriate, hierarchies for drill-down, and storage mode configuration appropriate to the data volume and refresh requirements. Using a shared semantic model means KPI definitions are written once and reused across dashboards rather than duplicated and potentially diverging per tile.
DataTerrain's Automated BI reports conversion service accelerates semantic model migration for large dashboard libraries.
Tableau to Power BI Dashboard Migration
Tableau to Power BI dashboard migration requires rebuilding content rather than importing files. There is no native import path between the two platforms. Each element must be mapped and rebuilt:
- Tableau worksheets and dashboards → Power BI report pages (visual-by-visual rebuild)
- Tableau calculated fields → Power BI DAX measures or calculated columns
- Tableau LOD expressions → DAX or model-level logic (requires functional conversion)
- Tableau parameters → Power BI parameters, slicers, or model logic
- Tableau action filters → Power BI cross-filter behavior or drill-through pages
- Tableau user permissions → Power BI workspace roles and Row-Level Security
- Tableau data connections → Power BI data sources with appropriate storage modes
Automated tooling can accelerate Tableau-to-Power BI dashboard migration at scale, particularly for metadata extraction, calculation mapping, and validation. Complex business logic, LOD conversions, and RLS configuration still require expert review regardless of the automation approach used.
Power BI Workspace Setup After Dashboard Migration
Design the Power BI workspace architecture before production deployment. Workspace structure determines how dashboards are owned, accessed, maintained, and governed after go-live. Key workspace setup decisions include:
- Workspace structure: separate development, test, and production workspaces prevent untested changes from reaching business users
- Workspace roles: assign Admin, Member, Contributor, and Viewer roles based on actual responsibilities, not convenience.
- Semantic model access: Publish shared semantic models to dedicated workspaces with controlled access, separate from the report workspaces that use them.
- Row-Level Security: RLS rules should be mapped from legacy access groups, tested per user persona, and validated before decommissioning legacy dashboards
- Refresh configuration: scheduled refresh settings, gateway configuration, and refresh failure notifications should be in place before production cutover
Dashboard Migration Challenges
- Drill-through logic: legacy drill-down paths and action filters don't import directly. They must be rebuilt as Power BI drill-through pages with correct filter pass-through behavior.
- Filter behavior: cross-filtering and action filters often behave differently in Power BI and need reconfiguration, not replication.
- RLS setup: legacy access groups must be re-mapped to Power BI Row-Level Security roles and tested individually to avoid access gaps or data exposure.
- KPI logic drift: target-vs-actual calculations rebuilt as DAX can silently diverge from the original if not validated line by line rather than visually.
- Data source compatibility: some legacy data sources require driver updates, connection reconfiguration, or on-premises gateway setup for Power BI access.
- Dashboard sprawl: years of ungoverned dashboard creation make an accurate inventory difficult without usage analytics. Without a rationalization step, sprawl is recreated in Power BI.
- User adoption: business users accustomed to legacy dashboard layouts may resist new navigation patterns. Structured training and parallel running support the transition.
Manual vs Automated Power BI Dashboard Migration
| Factor | Manual Migration | Automated Migration |
|---|---|---|
| Dashboard inventory | Manual cataloging | Automated discovery and metadata extraction |
| Calculation conversion | Manual DAX rewrite | Automation-assisted with expert review |
| Visual rebuild | Manual visual-by-visual rebuild | Automation-accelerated for standard visuals |
| Validation | Manual data comparison | Automated reconciliation plus manual review |
| Best for | Small or highly complex estates | Large dashboard estates with repeatable patterns |
Automation can accelerate inventory, metadata extraction, calculation mapping, and validation at scale. Complex business logic, RLS configuration, and quality assurance still require expert review alongside any automation approach.
How to validate a Power BI Dashboard Migration
Side-by-side validation between the legacy dashboard and Power BI before decommissioning the legacy environment. Validation covers five layers:
- Data validation: row counts, totals, aggregates, null values, and date-range outputs compared between legacy and Power BI
- KPI validation: calculated measures, targets, actuals, ratios, and time intelligence compared line by line, not just visually
- Visual validation: chart types, labels, conditional formatting, and drill-through behavior confirmed against the legacy layout
- Functional validation: slicers, cross-filters, drill-through pages, and navigation paths tested for correct behavior
- Security validation: workspace roles and RLS tested with representative user accounts from each security group before decommissioning
Best Practices for Dashboard Migration
- Inventory before rebuilding: a full dashboard inventory with usage data prevents wasted effort on dashboards nobody uses.
- Retire before migrating: retire dashboards with no views, no active owner, or those fully covered by another dashboard; don't rebuild them.
- Build the semantic model first: build the shared Power BI semantic model before any dashboard visuals to ensure consistent measures across all reports.
- Validate KPIs line by line: a dashboard can look correct while producing different numbers if the DAX logic has drifted from the original calculation.
- Test RLS with real user personas: admin-level testing cannot detect RLS configuration gaps that only appear at the end-user level.
- Set up workspace structure early: workspace roles, refresh configuration, and governance should be in place before dashboards are published, not after.
- Run parallel environments: keep legacy and Power BI running simultaneously with daily validation until user adoption is confirmed and stable.
- Consolidate duplicates: merge near-duplicate dashboards built by different teams for similar KPIs into shared reports with role-based filtering, rather than rebuilding them separately.
Power BI Dashboard Migration Checklist
Before Migration
- Inventory all dashboards, reports, tiles, KPIs, and owners
- Analyze usage: identify dashboards to migrate, consolidate, or retire
- Classify dashboards by complexity tier
- Document all data sources, connections, and dependencies
- Document all calculations, measures, and KPI logic
- Identify security requirements and RLS rules
During Migration
- Rebuild Power BI semantic model before visuals
- Convert legacy calculations into DAX measures
- Rebuild dashboard visuals, slicers, and drill-through pages
- Configure Power BI workspace structure and roles
- Configure Row-Level Security and refresh schedules
Before Cutover
- Validate data, KPIs, and calculations against legacy
- Test filter, slicer, and drill-through behavior
- Test RLS with representative user accounts per role
- Obtain business sign-off from dashboard owners
After Migration
- Monitor usage, refresh performance, and user feedback
- Retire legacy dashboards after stable adoption confirmed
- Document migrated business logic and semantic model structure
Illustrative Example: Dashboard Consolidation at Scale
A retail enterprise running a large portfolio of Tableau dashboards across regional teams needed to consolidate onto Power BI after standardizing on Microsoft 365. Many dashboards were near-duplicates built by different teams for similar KPIs, with inconsistent filter and RLS setups.
The team ran a full dashboard inventory tiered by complexity, rebuilt a shared Power BI semantic model first, then used an automated Tableau-to-Power BI conversion approach to accelerate the tier-by-tier rebuild: starting with simple, single-source Tableau worksheets before tackling complex, RLS-heavy dashboards. Near-duplicate dashboards were consolidated into shared reports with role-based filtering instead of being rebuilt one-for-one, and automation kept KPI and filter logic consistent across the consolidated set.
This illustrates the type of Power BI dashboard migration approach DataTerrain supports through its migration methodology and tooling.
Migrate Dashboards to Power BI With DataTerrain
17 Years Experience | 400+ US Clients | Tableau to Power BI | Semantic Model Rebuild | Automated Conversion
DataTerrain is a specialist data engineering and analytics migration company that migrates dashboards to Power BI from Tableau, Cognos, QlikView, SSRS, Crystal Reports, and legacy Power BI environments. Our automated BI reports conversion service accelerates dashboard inventory, DAX conversion, validation, and workspace deployment at scale.
Here is what matters most
- Power BI dashboard migration is a rebuild process, not a lift-and-shift. Calculations, filters, security, and visual behavior must be redesigned, not copied.
- Build the semantic model before rebuilding any dashboard visuals. Inconsistencies at the data layer propagate to every KPI and tile.
- Retire before migrating. Use usage data to drive the cut list: dashboards with no active users or owners should not be rebuilt.
- Validate KPIs line by line, not visually. A dashboard can look correct while producing different numbers if DAX logic has drifted from the original calculation.
- Test RLS with real user personas. Admin-level testing cannot surface access gaps that only appear at end-user level.
Final Thoughts
Power BI dashboard migration delivers the most value when it is treated as a modernization opportunity rather than a copy exercise. Organizations that invest in a structured inventory, retire low-usage dashboards before rebuilding, construct a shared semantic model first, and validate KPI logic line by line consistently achieve cleaner, more governed Power BI environments than those that simply recreate what existed in the legacy tool.
The four-stage process- inventory, semantic model rebuild, dashboard rebuild, and validation and rollout- keeps migration focused and measurable at every step. Whether migrating from Tableau, Cognos, QlikView, or an older Power BI workspace, the foundation is the same: accurate data, consistent measures, well-governed workspaces, and dashboards that business users actually trust.
Contact DataTerrain to discuss your dashboard migration and build a delivery plan around your actual reporting estate.
Related Articles
- Power BI Advantages and Key Benefits: A Complete Enterprise Guide
- Tableau vs Power BI: A Comprehensive Comparison
- Jaspersoft vs Power BI: A Comprehensive Comparison
- IBM Cognos vs Power BI: A Comprehensive Comparison
- BI Modernization Checklist: A Step-by-Step Guide for Enterprises