• Reports Conversion
  • Oracle HCM Analytics
  • Oracle Health Analytics
  • Services
    • ETL SolutionsETL Solutions
    • Performed multiple ETL pipeline building and integrations.

    • Oracle HCM Cloud Service MenuTalent Acquisition
    • Built for end-to-end talent hiring automation and compliance.

    • Data Lake IconData Lake
    • Experienced in building Data Lakes with Billions of records.

    • BI Products MenuBI products
    • Successfully delivered multiple BI product-based projects.

    • Legacy Scripts MenuLegacy scripts
    • Successfully transitioned legacy scripts from Mainframes to Cloud.

    • AI/ML Solutions MenuAI ML Consulting
    • Expertise in building innovative AI/ML-based projects.

  • Contact Us
  • Blogs
  • BI Insights Hub
  • Employee Engagement Business Intelligence Dashboards
  • 06 July 2026

Driving Employee Engagement with Business Intelligence Dashboards

Employee engagement with BI dashboards is what separates a reporting investment that pays off from one that quietly goes unused. Many organizations roll out new dashboards, then assume usage will follow because the data is technically available. In practice, dashboard adoption depends on the same things as any new workplace tool: relevance to the person using it, ease of access within their existing workflow, and a surrounding culture that treats data as something to explore rather than something to fear. This guide walks through practical, role-specific strategies for building that kind of engagement, from personalized views to the habits that keep dashboards part of daily work rather than a one-time rollout.

Why Dashboard Adoption, Not Just Deployment, Determines BI ROI

A dashboard that nobody opens delivers zero value no matter how well it was built. Return on a BI investment comes from the decisions it actually influences, which means adoption sits at the center of the equation rather than at its edge. Teams that treat rollout as the finish line often see strong initial logins followed by a steady decline, while teams that plan for ongoing engagement see usage hold steady or grow as dashboards become part of how decisions get made.
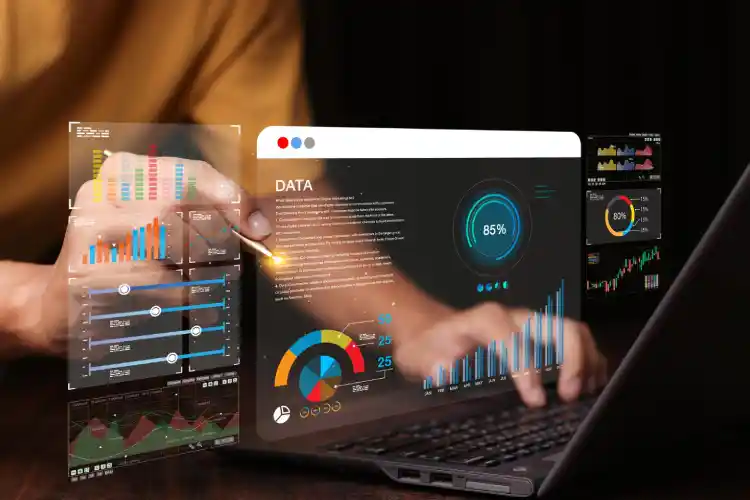
Employee Engagement Business Intelligence Dashboards
  • Share Post:
  • LinkedIn Icon
  • Twitter Icon

Personalize Dashboards by Role Instead of Building One for Everyone

A single dashboard built to serve sales, marketing, and finance at once usually serves none of them well. Each function needs a different set of metrics, filtered to what is actually actionable for that role, rather than a shared view cluttered with numbers that only matter to one department. Building role-specific views from the start, even when they pull from the same underlying data model, removes one of the most common reasons employees stop opening a dashboard after the first week. Organizations rebuilding dashboards as part of a broader BI platform transition have a natural opportunity to design these role-based views from the start, rather than retrofitting personalization onto an existing one-size-fits-all report.

Bring BI Into the Tools Employees Already Use Daily

Requiring employees to log into a separate analytics portal adds friction that quietly suppresses usage over time. Embedding key metrics directly into the platforms teams already rely on, including Slack, Microsoft Teams, or CRM systems like Salesforce, keeps data visible inside the natural flow of work rather than treating it as a separate destination to remember to visit.

Build Habits Through Usability and Continuous Learning

Dashboards that require advanced technical skill to navigate will see engagement drop regardless of how valuable the underlying data is. Interactive, easy to filter visuals lower that barrier for non-technical users. Short, role-specific training sessions and drop-in support, offered on an ongoing basis rather than as a single onboarding event, help employees build confidence interpreting what they see rather than guessing at it.

Create a Data-Driven Culture Where Leaders Use Dashboards Visibly

Employees take cues from how leadership behaves. When executives reference dashboard data directly in meetings and use it to explain decisions, it signals that the data is genuinely part of how the organization operates rather than a reporting exercise that happens in parallel to the real conversation. Giving employees room to explore data and ask their own questions, rather than only consuming pre-built reports, builds the kind of ownership that keeps a BI platform active long after launch.

Use Recognition and Friendly Competition to Reinforce Usage

Connecting dashboard metrics to recognition programs turns data visibility into something positive rather than something that only flags problems. Lightweight gamification, such as friendly leaderboards tied to metrics the team already tracks, gives employees a reason to check in regularly, while integrating BI data with existing recognition platforms highlights top performers in a way that reinforces engagement rather than monitoring.

Frequently Asked Questions

What is the most common reason BI dashboard adoption fails?
The most frequent cause is a dashboard that does not match what the viewer actually needs day to day. When the metrics shown are not directly actionable for that person's role, usage drops off quickly even if the underlying data is accurate and well organized.
How can companies personalize BI dashboards for different teams?
Building role-based views from a shared data model, rather than a single general dashboard for the whole organization, lets each team see only the metrics relevant to their work, keeping the experience focused and easier to act on.
How does embedding dashboards into daily tools improve engagement?
Placing key metrics within tools employees already use, such as Slack, Microsoft Teams, or a CRM, removes the extra step of logging into a separate portal, keeping data part of the natural workflow rather than an additional task to remember.
Can gamification really improve BI dashboard usage?
Yes, when it is tied to metrics employees already care about and connected to genuine recognition rather than pressure. Friendly competition and visibility for top performers tend to increase the frequency with which dashboards are checked.

Dashboard adoption is rarely about the technology itself. It comes down to whether the data shown is relevant to the person viewing it, how easily they can reach it during their normal workflow, and whether the organization treats data exploration as a shared habit rather than a top-down report. Strategies that combine personalization, embedded access, and a visibly data-driven culture tend to keep BI platforms active well beyond their first few months in production.

Related Articles

BI Tools for HR Teams: Driving Smarter Workforce Decisions   |   BI Solutions Implementation Challenges   |   How BI Modernization Drives Data-Driven Growth

Categories
  • All
  • BI Insights Hub
  • Data Analytics
  • ETL Tools
  • Oracle HCM Insights
  • Legacy Reports conversion
  • AI and ML Hub

Ready to initiate your BI Migration Journey?

Start Now
Customer Stories
  • All
  • Data Analytics
  • Reports conversion
  • Jaspersoft
  • Oracle HCM
Recent posts
  • employee-engagement-business-intelligence-dashboards
    Driving Employee Engagement with Business...
  • key-benefits-of-bi-modernization-legacy-migration
    Key benefits of BI modernization when...
  • how-bi-automation-simplifies-report-migration
    From Any to Any: How BI Automation...
  • BI Modernization
    The Benefits of BI Modernization for Data-Driven...
  • BI Service Providers
    How BI Service Providers Can Transform...
  • Business Intelligence Services Company
    Migrating from legacy BI tools to modern...
  • Amazon QuickSight vs Tableau
    Amazon QuickSight vs Tableau: Key...
  • Amazon QuickSight vs Power BI
    Amazon QuickSight vs Power BI: A...
  • Difference between Quicksight and Tableau
    Difference Between QuickSight...
  • Oracle BI Publisher vs OTBI
    Difference Between Oracle BI Publisher and...
  • Oracle BI Publisher to Amazon QuickSight
    Automated BI migration from Oracle BI...
  • HCM Cloud Transformation
    Hitachi Consulting realizes significant...
  • HCM Cloud Application Performance
    How to measure HCM Cloud Application...
  • benefits of cloud-based  bi systems
    Benefits of Cloud-Based BI System...
  • Hiring challenges: Understanding the obstacles to better recruitment
    Hiring challenges: Understanding the obstacles...
  • Better HR Insights
    4 ways financial data leads to better HR...
  • Cloud-Based HCM
    3 Surprising Benefits of Cloud-Based HCM...
  • millennial workforce
    3 Remarkable Statistics About the Millennial...
  • 3-practices-to-ensure-strong-corporate-leadership
    3 Practices to Ensure Strong Corporate...
  • tibco-jaspersoft-shows-the-way-in-embedding-bi-on-demand
    TIBCO Jaspersoft: Embedded Analytics at...
  • data-engineering-service
    What are the key benefits of data engineering...
Connect with Us
  • About
  • Careers
  • Privacy Policy
  • Terms and condtions
Sources
  • Customer stories
  • Blogs
  • Tools
  • News
  • Videos
  • Events
Services
  • Reports Conversion
  • ETL Solutions
  • Data Lake
  • Legacy Scripts
  • Oracle HCM Analytics
  • BI Products
  • AI ML Consulting
  • Data Analytics
Get in touch
  • connect@dataterrain.com
  • +1 650-701-1100

Subscribe to newsletter

Enter your email address for receiving valuable newsletters.

logo

© 2026 Copyright by DataTerrain Inc.

  • twitter